Curated OER
Coloring Interval Graphs
Young scholars investigate planning an activity and getting it done on time. In this algebra instructional activity, students define vocabulary words related quadratic equations, including the vertex and intervals. They figure a good way...
Curated OER
Bar Graphs and Pie Charts
Students graph data they collected and analyze it using a bar graph. In this algebra instructional activity, students analyze their data using pie charts and bar graphs while explaining the meaning to each other. They compare and...
Curated OER
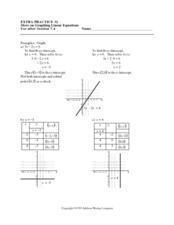
More on Graphing Linear Equations
In this graphing worksheet, young scholars graph linear equations, identify the x or y-intercept. Graph paper is provided below each equation. There are nine problems on this two-page worksheet.
Curated OER
Graph the Presidents At Inauguration- How Old Were They?
Students construct a graph of the presidents' ages at inauguration. In this U.S. history instructional activity, students use online resources to gather data about the presidents and accurately present their results on a graph.
Curated OER
Trigonometry Practice: Trigonometric Graphs #2
In this trigonometric functions worksheet, students solve 8 multiple choice and graphing problems. Students graph trigonometric functions given an equation and match graphs to a given scenario.
Curated OER
Surveys and Graphing
First graders survey different classrooms to determine types of products students would like to see sold at school, and create graphs based on survey results.
Curated OER
Forces and Graphing
Students analyze graphs to determine relationships between variables and rates of change. They determine the basic concepts about static reaction forces. They determine the slope and equation of a line.
Curated OER
Farm Stories, Animal Webbing, Favorite Farm Animal Graph
Students brainstorm animals they would expect to see on a farm. They save these on a Kidspiration web. Students watch or read a farm story. They discuss the characters. Students vote for their favorite farm animal and crate a graph using...
Curated OER
Using Excel To Teach Probability And Graphing
Students engage in the use of technology to investigate the mathematical concepts of probability and graphing. They use the skills of predicting an outcome to come up with reasonable possibilities. Students also practice using a...
Curated OER
Graphing Surveys and Analyzing Data
Young scholars analyze data and graph the results of their surveys. In this statistics lesson plan, students create graphs using excel to make graphs to be able to better observe their data. They conclude how great we as unique individuals.
Curated OER
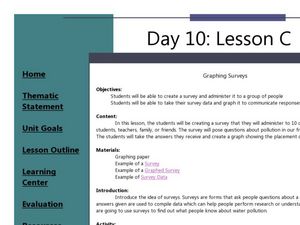
Graphing Surveys
Students collect data and graph it. In this algebra lesson plan, students create a survey for their classmates and teachers. They analyze the results from the survey and graph it. They draw conclusion from their data based on the graph.
Curated OER
Green Food Graph
Students explore graph making by investigating St. Patrick's day food. In this holiday food lesson, students discuss their favorite green foods in honor of St. Patrick's day. Students create a graph based on the data of which green foods...
Curated OER
Graphing the Past Using Today's Technology
Eighth graders research statistical data regarding their current social studies unit. They write questions about the measures of central tendency, collect and analyze the data, insert the data into a spreadsheet, and generate graphs.
Curated OER
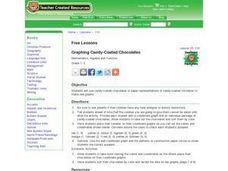
Graphing Candy-Coated Chocolates
Students place pieces of candy on their coordinate graphs as the teacher calls out the colors and coordinates embedded in the plan. The teacher circulates around the class to check each student's answers for accuracy.
Curated OER
Graphs and Measurement
Tenth graders analyze graphs and by comparing trees. In this geometry lesson, 10th graders investigate the use of different graphs using bar and regular graphs. They work groups at the computer.
Curated OER
Object Graphs
Students identify geometric shapes, demonstrate construction of an object graph, compare sets of objects, estimate which student has the most geometric shapes in his or her bag, and play computer game Jump Start Kindergarten.
Curated OER
Ashes to Ashes: Using Evaporation Rate to Identify an Unknown Liquid
Learners explore the concept of evaporation rates in this evaporation rates lesson. They will try to identify the chemical that began a fire, perform an experiment where they use the evaporation rates to determine the unknown liquid, and...
Curated OER
Graphing Toad/ Frog Respiration
Students measure respiratory rates on live toads, and the effect water temperature has on their findings. In this scientific method lesson, students record their findings and present them in a graph, comparing the results.
Curated OER
Computation: How can we use rice to solve problem questions?
Fourth graders graph metric tons of rice produced by various countries. In this graphing lesson plan, 4th graders follow problem solving steps to answer questions about rice nutrition and then graph the amount of rice produced by...
Curated OER
M&Ms; Line Plots and Graphing
Students, using small individual bags of M&Ms, engage in activities including; estimating, sorting, graphing, mean, median, mode, fractions, percentage, and averaging.
Curated OER
Using Excel to Reference and Graph Live Data from a Web Site
Learners collect live buoy data about water temperatures in the Gulf of Mexico from the Internet and work individually to organize their data and create a line graph using Excel Spreadsheet. Students analyze their data and examine any...
Curated OER
Graphing Solutions
In this graphing solutions worksheet, 9th graders solve 13 various types of problems. First, they find the solution of each systems by graphing on the coordinate plane provided. Then, students solve each systems of equations...
Curated OER
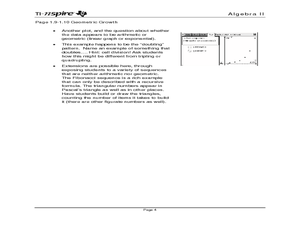
Sequence Graphs
Investigate arithmetic and geometric sequences by using a graphing calculator to determine if a sequence is linear or exponential.
Curated OER
Graphing Conics
Learners explore conics using four different graphs. In this calculus lesson, students analyze parabola, hyperbolas, circles and ellipses. They find the directrix and discuss how they relate to each type of graph.
Other popular searches
- Coordinate Graphing Pictures
- Graphing Ordered Pairs
- Graphing Skills Lesson Plans
- Coordinate Graphing
- Graphing Linear Equations
- Holiday Coordinate Graphing
- Graphing Linear Inequalities
- Graphing Calculator
- Graphing Inequalities
- Halloween Math Graphing
- Graphing Mean, Median, Mode
- Graphing Data


