Shodor Education Foundation
InteGreat
Hands-on investigation of Riemann sums becomes possible without intensive arithmetic gymnastics with this interactive lesson plan. Learners manipulate online graphing tools to develop and test theories about right, left, and...
Learner
Solid Shapes
A collection of two lessons, kindergartners will identify two-dimensional shapes in solid shapes. They will develop basic knowledge of the components that make up a sphere, rectangular prism, pyramid, cylinder, cone, and cube. Young...
Willow Tree
Solving Equations and Inequalities with Absolute Value
The concept of absolute value can be difficult for learners to grasp. Reinforce their understanding of a basic absolute value expression and connect it to solving equations and inequalities. Scholars write two equations/inequalities to...
Curated OER
Chairs Around the Table
Youngsters become flexible problem solvers with this challenging lesson. If there are 24 square tables in a restaurant, how many customers can be seated at one time? They can use manipulatives or draw pictures to help them find the...
Michigan State University
Bug Lyphe!
Introduce ecology classes to biodiversity and interdependence in ecosystems with a PowerPoint presentation. Then, they get up-close and personal with the invertebrate world by collecting insects, classifying them, and graphing their...
Curated OER
Exponential Growth versus Linear Growth II
Your algebra learners discover that exponential functions, with a base larger than one, outgrow linear functions when the inputs increase sufficiently. Their analysis includes using a graphing calculator to produce tables.
Centers for Disease Control and Prevention
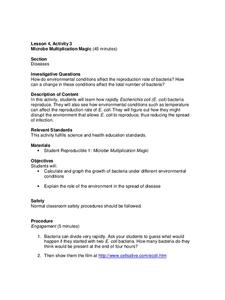
Microbe Multiplication Magic
A lesson introduces the reproduction rate of E. coli though a video. Then scholars complete a data table and graph of reproduction rates in ideal conditions as well as less than ideal conditions.
NOAA
Biological Oceanographic Investigations – Keep Away
As of 2015, there are 53,481 oil wells in the Gulf of Mexico. Scholars determine how species diversity is impacted based on the ecosystem's distance from a drilling platform. It focuses on finding the mean of data sets...
Project Maths
Introduction to Quadratics
Develop conceptual knowledge of a quadratic equation and its solutions in your classes. The third algebra lesson in a series of four introduces learners to solving quadratic equations slowly. The first activity explores the zero product...
EngageNY
Curves from Geometry
Take a another look at ellipses. The seventh segment in a series of 23 in a Precalculus module continues to investigate the graph and equation of an ellipse from the previous lesson. Scholars investigate the fact that the sum of...
Curated OER
Super Ticket Sales
Use this graphing data using box and whisker plots instructional activity to have learners make box and whisker plots about ticket sales of popular movies. They find the mean, median, and mode of the data. Pupils compare ticket sales of...
Curated OER
Linear Regression and Correlation
Learners explore scatter plots. In this linear regression lesson, groups of pupils graph scatter plots and then find the line of best fit. They identify outliers and explain the correlation. Each group summarizes and shares their...
Curated OER
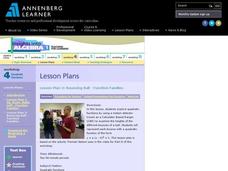
Bouncing Ball : Function Families
A bouncing ball serves as more than entertainment when learning to apply quadratic functions to real-world events. This is the second of a two-part lesson, which can also be accessed from the website. The instructions say to measure the...
American Statistical Association
The Taste of Yellow
Does lemonade taste better when yellow? A tasty experiment has scholars determine the answer to the question. It requires conducting a taste test with lemonades of different colors (from food coloring), and then collecting and analyzing...
Illustrative Mathematics
Electoral College
A cross-curricular resource that takes the electoral votes and allows your learners to organize and analyze the data. Young voters can determine which states are more influential and interpret the dotplot provided for more data....
MARS, Shell Center, University of Nottingham
Defining Regions Using Inequalities
Your young graphers will collaboratively play their way to a better understanding of the solution set produced by the combining of inequalities. Cooperation and communication are emphasized by the teacher asking questions to guide the...
Mathematics Assessment Project
Representing Inequalities Graphically
A new, improved version of the game Battleship? Learners graph linear inequalities on the coordinate plane, then participate in a game where they have to guess coordinate points based on the solution to a system of linear...
EngageNY
A Surprising Boost from Geometry
Working with imaginary numbers — this is where it gets complex! After exploring the graph of complex numbers, learners simplify them using addition, subtraction, and multiplication.
Mathematics Assessment Project
Classifying Equations of Parallel and Perpendicular Lines
Parallel parking might be difficult, but finding parallel lines is fairly simple. In this lesson, learners first complete an assessment task involving parallel and perpendicular lines in the coordinate plane. Individuals then take part...
EngageNY
Solution Sets to Simultaneous Equations (part 1)
How are systems related? Build on your pupils' previous knowledge of solving systems of equations by introducing systems of inequalities. Learners explore similarities between systems of equations and inequalities to make a strong...
Education Development Center
Points, Slopes, and Lines
Before graphing and finding distances, learners investigate the coordinate plane and look at patterns related to plotted points. Points are plotted and the goal is to look at the horizontal and vertical distances between coordinates and...
Polar Trec
Global Snow Cover Changes
Snow is actually translucent, reflecting light off its surface which creates its white appearance. Pairs or individuals access the given website and answer questions about snow cover. They analyze graphs and charts, examine data, and...
University of Colorado
Distance = Rate x Time
Every year, the moon moves 3.8 cm farther from Earth. In the 11th part of 22, classes use the distance formula. They determine the distance to the moon based upon given data and then graph Galileo spacecraft data to determine its movement.
K20 LEARN
Ace in the Hole
How does inertia affect an object's trajectory? After watching a video on safety belt use, pupils discuss the notions of inertia. Using their knowledge, individuals try to drop a ball on a target while running, and classmates observe the...
Other popular searches
- Coordinate Graphing Pictures
- Graphing Ordered Pairs
- Graphing Skills Lesson Plans
- Coordinate Graphing
- Graphing Linear Equations
- Holiday Coordinate Graphing
- Graphing Linear Inequalities
- Graphing Calculator
- Graphing Inequalities
- Halloween Math Graphing
- Graphing Mean, Median, Mode
- Graphing Data


