CK-12 Foundation
Ck 12: Algebra: One Step Inequalities
[Free Registration/Login may be required to access all resource tools.] In this lesson, students solve inequalities and graph their solutions. Students examine guided notes, review guided practice, watch instructional videos and attempt...
Other
Linear Functions, Slope and Regressions
Find activities here for linear functions, slopes and regression lines. Use them for classroom work or individual assignments.
Texas Instruments
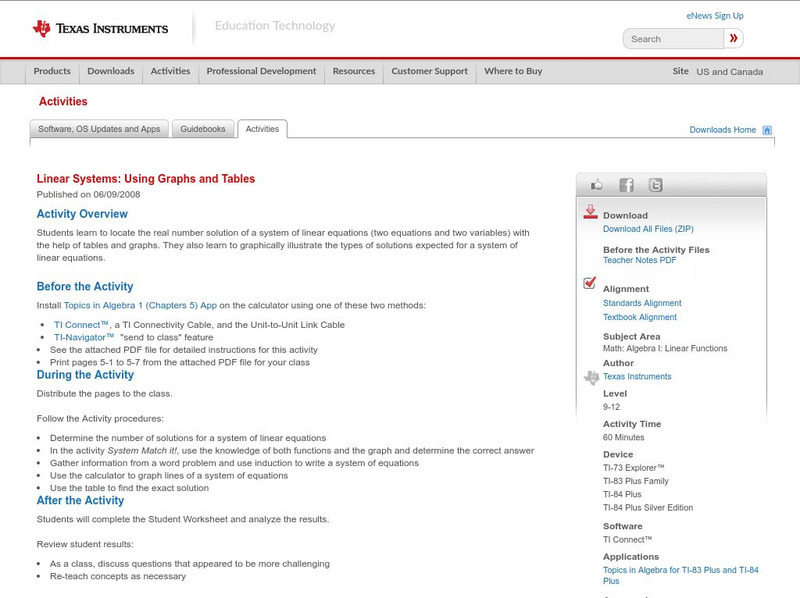
Texas Instruments: Linear Systems: Using Graphs and Tables
Students learn to locate the real number solution of a system of linear equations (two equations and two variables) with the help of tables and graphs. They also learn to graphically illustrate the types of solutions expected for a...
Texas Instruments
Texas Instruments: Graphing Systems of Linear Equations
Students will solve systems of linear equations by graphing.
Wyzant
Wyzant: Function Graphing Calculator
Students input a function in either y= of f(x)= form, and then the site from WyzAnt does the rest! A detailed graph is shown in less than a second. Students can change the window used to view the graph as well as whether to have...
Khan Academy
Khan Academy: Solutions of Systems of Inequalities
Check whether an ordered pair is a solution of a system of two-variable linear inequalities. Students receive immediate feedback and have the opportunity to try questions repeatedly, watch a video, or receive hints.
Khan Academy
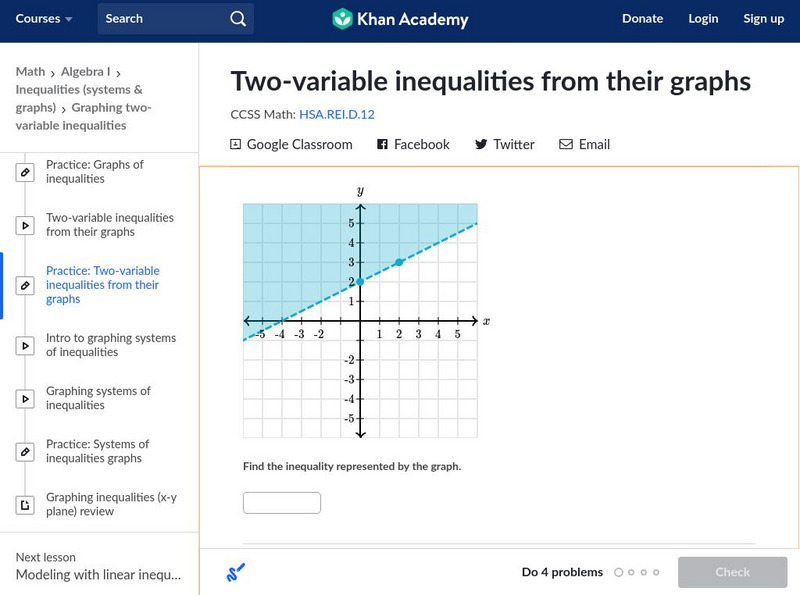
Khan Academy: Two Variable Inequalities From Their Graphs
Fit an algebraic two-variable inequality to its appropriate graph. Students receive immediate feedback and have the opportunity to try questions repeatedly, watch a video, or receive hints.
Texas Education Agency
Texas Gateway: Determining the Domain and Range for Linear Functions
Given a real-world situation that can be modeled by a linear function or a graph of a linear function, the student will determine and represent the reasonable domain and range of the linear function using inequalities.
Math Planet
Math Planet: Algebra 2: Graph Inequalities
How to graph an inequality is explained through examples and a video lesson. [4:14]
CK-12 Foundation
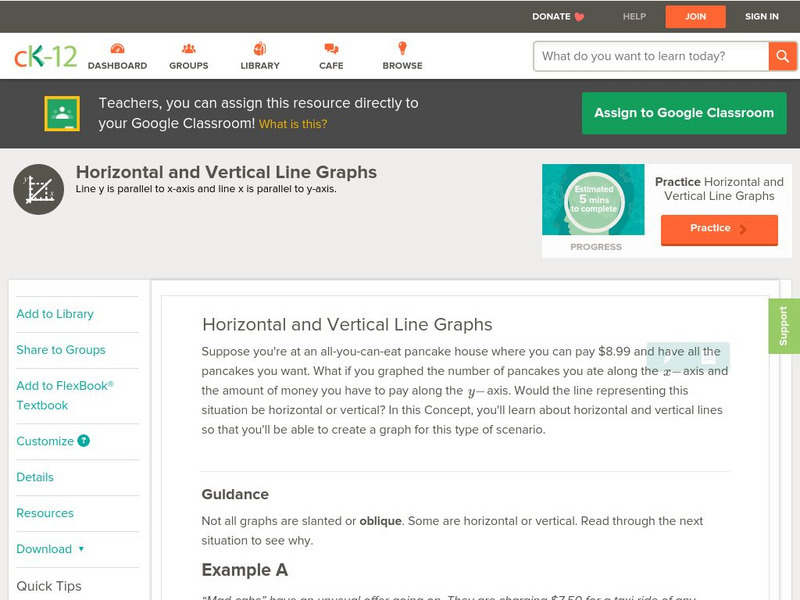
Ck 12: Algebra: Horizontal and Vertical Line Graphs
[Free Registration/Login may be required to access all resource tools.] Learn how to graph horizontal and vertical linear equations.
Sophia Learning
Sophia: Graphing Using Intercepts Tutorial
Follow step by step instruction to solve for x and y-intercepts, plot points, and graph the linear function.
CK-12 Foundation
Ck 12: Algebra: Applications With Inequalities
[Free Registration/Login may be required to access all resource tools.] Solve inequalities and represent the solution in equation notation, set notation, interval notation, or solution graph. Students examine guided notes, review guided...
McGraw Hill
Glencoe Mathematics: Online Study Tools: Self Check Quiz on Inequalities
The online assessment displays knowledge of concepts used in Algebra I. The multiple choice questions test learners on linear inequalities. Topics include graphing and solving inequalities.
CK-12 Foundation
Ck 12: Algebra: Absolute Value Inequalities
[Free Registration/Login may be required to access all resource tools.] In this lesson students solve problems involving absolute values and inequalities. Students can watch a video tutorial, explore guided notes and attempt practice...
Khan Academy
Khan Academy: Equations & Inequalities Word Problems
HSA-CED.A.1: Interactive resource which create equations and inequalities in one variable and use them to solve problems. Include equations arising from linear and quadratic functions, and simple rational and exponential functions....
Texas Instruments
Texas Instruments: Winning Inequalities (Part 1)
Students write and interpret a linear equation and an inequality with two variables and use the Inequality Graphing Application to map inequalities on a coordinate plane.
Texas Instruments
Texas Instruments: Linear Programming Cookie Dough Kits
In this lesson students explore the concept of linear programming. The students model a real life situation with a system of inequalities and then use their graphing calculators to search for a maximum value for an objective function....
Texas Instruments
Texas Instruments: Linear Programming and the Inequalz App
This activity uses the Inequality Graphing Application to take some of the frustration out of linear programming.It allows students to concentrate on the important part of the lesson, so they can learn the basic concepts with greater depth.
Illustrative Mathematics
Illustrative Mathematics: F Le What Functions Do Two Graph Points Determine?
In this task, young scholars find a unique linear function, a unique exponential function, and more than one quadratic function that go through the same two points on the coordinate grid. Aligns with F-LE.A.
Alabama Learning Exchange
Alex: Graphing Is Great!
Students will explore graphing individually and in groups. They will also use an interactive activity to discuss slope and intercepts. To assess the lesson, students will use the floor tiles in the classroom as a large sheet of graph...
CK-12 Foundation
Ck 12: Linear Equations: Temperature Transitions
[Free Registration/Login Required] Students learn how to solve equations with variables using the given graph. Click challenge me to answer practice questions and click learn more to watch a video.
Varsity Tutors
Varsity Tutors: Hotmath: Practice Problems: Graphing Systems of Inequalities
Nineteen problems present a variety of practice solving linear systems by graphing systems of inequalities. They are given with each step to the solution cleverly revealed one at a time. You can work each step of the problem then click...
University of Regina (Canada)
University of Regina: Math Central: Graphing a System of Inequalities
A solution is presented to a student-submitted problem. The problem involves graphing and finding the solution set to a system of inequalities.
ClassFlow
Class Flow: Graphing Inequalities
[Free Registration/Login Required] Students represent functional relationships using tables, equations, and graphs, and describe the connection among these representations.


