Curated OER
Using Proportions to Estimate
Students calculate ratio and proportion. In this unit rates lesson, students estimate using proportions and find their errors in doing so. They calculate unit rates and define the concept of unit rates.
Curated OER
Applied Science - Built Environment Lab
Young scholars evaluate trash. For this Science lesson, students collect and weigh trash from their classrooms. Young scholars categorize the trash and the corresponding weights, recording the information on a data sheet.
Curated OER
Patterns Here, There, and Everywhere!
Upper graders access the Microsoft Word program and create patterns by utilizing certain keys on the keyboard. They create picket fences, smiley faces, and hearts. It seems that this lesson has as much to do with keyboarding skills as it...
Curated OER
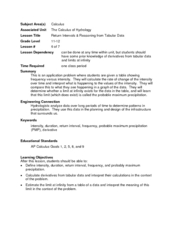
Return Intervals & Reasoning from Tabular Data
Learners calculate derivatives from a set of data. In this calculus lesson, students estimate the limit at infinity. They complete a Return Interval handout at the end of the lesson.
Curated OER
Nim: A Game Played All Over the World
Students participate in a European subtraction game. In this subtraction lesson, students use pebbles to demonstrate different subtraction strategies. The students use a deduction strategy to be the first one left with no pebbles.
Curated OER
Find The Best Car
Consider how to use consumer reports to review performance, price, reliability and safety information about specific cars. Young learners review how life styles and economics affect car choices. They then find solutions for car-buying...
Curated OER
Solving Equations Using Two Operations
Need more detail in showing your class how to solve two-step equations and proportions? This lesson plan outlines the steps young mathematicians need to solve simple equations and check their results.
Curated OER
Data Collection
Students investigate qualitative and quantitative data. In this statistics lesson, students gather data on heights and weights of people and graph the distribution. Students discuss the differences between qualitative and quantitative data.
Curated OER
An Investigative Task
Pupils read an article about statistics. In this statistics instructional activity, students are given a detailed overview about statistics and what it entails. This instructional activity is more informational and hands on.
Curated OER
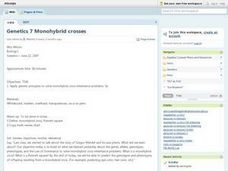
Monohybrid Crosses
Students define the terms monohybrid cross and Punnett Square. As a class, they discuss the Law of Segregation and probability to complete a practice problem. To end the lesson plan, they predict the probability of certain types of...
Curated OER
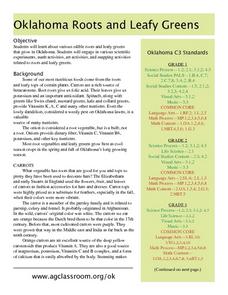
The Beet Goes On
Root vegetables inspire the series of activities included here. Class members participate in activities related to language arts, social studies, science, visual art, and math. At first, the long list might feel overwhelming; however,...
Curated OER
What's The Point?
Students solve word problems using the correct math symbols. In this algebra lesson, students use the TI calculator to graph their equation and analyze it. They find the line of regression and use to draw conclusion.
Curated OER
Look at Those Leaves!
Learners observe leaves. For this math and science cross-curriculum leaf lesson, students take a nature walk and collect leaves. Attributes are assigned and leaves are sorted in various ways. Learners use non-standard or standard units...
Albert Shanker Institute
Economic Causes of the March on Washington
Money can't buy happiness, but it can put food on the table and pay the bills. The first of a five-lesson unit teaches pupils about the unemployment rate in 1963 and its relationship with the March on Washington. They learn how to create...
Curated OER
Fractals and the Chaos Game
Students explore the concept of fractals. In this fractals lesson, students play the "Chaos Game" via an applet. Students place dots on the screen to recognize that they have created Sierpinski's Triangle.
Curated OER
Statistics and Shopping
Learners explore the concept of using consumer data and statistics to aid in the consumer decision making process. For this consumer data and statistics lesson, students research consumer data and statistics. Learners analyze the data...
Curated OER
Entrance Ticket
Students collect data on different events and word problems. In this algebra lesson, students use a table to organize their data. They graph their coordinate pairs on a coordinate plane and make predictions.
Curated OER
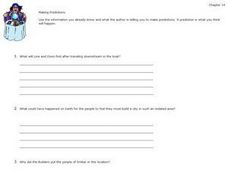
Making Predictions
Learners explore the concept of probabiility and outcome through several decision making activities. Making accurate predictions in daily life including weather forecasting, stock market selections, or job changes are all dependent on...
Curated OER
RCX Car Line Graph
Students develop a line graph based on distances that an RCX car drives in specified amounts of time. They then are given a specific amount of time for the car to drive and be asked to extrapolate the car's distance from the graph.
Curated OER
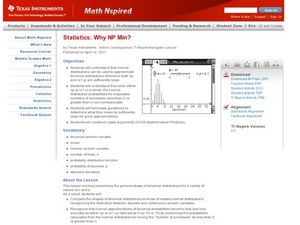
Why NP Min?
Students calculate the normal distribution. In this statistics lesson, students use the normal distribution to estimate binomial distributions. They define when to use NP and n(1-p) to make approximations.
Curated OER
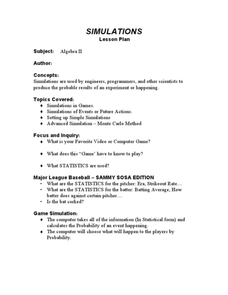
Simulation and Statistics
Students perform simulation of video games as they explore statistics. In this algebra activity, students relate concepts of statistics and data collection to solve problems. They decide their next step based on the previous assessment...
Curated OER
Graphing and the Coordinate Plane
Students gain practice reading coordinates and plotting points by participating in the Coordinates! Game. They demonstrate and test their skills with graph paper and the Maze Game.
Curated OER
Binomial Distribution
Students explore the concept of binomial distribution. In this binomial distribution instructional activity, students perform binomial distributions on a number of problems in this lecture instructional activity. Students find the mean...
Curated OER
Students use fundamental counting principle to compute combinations and permutations
Students define Pascal's triangle and special notations used to represent nth elements. In this geometry lesson, students solve problems using permutations and combinations. They compare the formula for permutation to that of Pascal's...
Other popular searches
- Fun Math Probability Games
- Probability/math Literature
- Smart Board Math Probability
- Grade 1 Math Probability
- Math Probability Vocabulary
- Math Probability Worksheets
- Sport Math Probability
- Math Probability Factorial
- Math Probability Games
- Grade 4 Math Probability
- Math Probability Lessons
- Probability and Sports Math


