K20 LEARN
If Our Classroom Were The World: Proportions And Percents
It's a small world after all. Classmates consider world population, languages, and religions in a cross-curricular lesson. Applying percentages and proportions, they determine what the class make-up would be if the class represented the...
CCSS Math Activities
Sandwich Shop
Eat up the task on systems of equations. Given information on the total number of sandwiches and the total income, learners write and solve a linear system of equations to find the number of each type of sandwich sold at a shop. They...
PBS
The Lowdown — Exploring Changing Obesity Rates through Ratios and Graphs
Math and medicine go hand-in-hand. After viewing several infographics on historical adult obesity rates, pupils consider how they have changed over time. They then use percentages to create a new graph and write a list of questions the...
PBS
The Lowdown — Rot and Rubbish: The Rancid Truth about How Much Food We Waste
Compare waste a percent at a time. The resource contains an infographic on food waste. Using images, the informative activity describes the amount and types of food waste that occur. Pupils compare the percentage of waste from their...
Concord Consortium
Rule of 72
Find an easier way to double it. Using the price of an item and the Consumer Price Index, learners determine how long it will be for the price to double. Scholars calculate the length of time it would take for the price to double using a...
Radford University
Corn and Popcorn
Have a popping good time. Using probability and statistics skills, learners determine which type of popcorn to buy based on the percentage of kernels popped. After analyzing corn and popcorn sales to make a prediction of future sales,...
Radford University
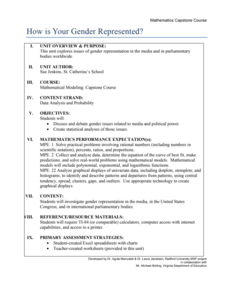
How Is Your Gender Represented?
Does the media shape people's views on gender? Scholars use data on gender portrayal in magazines to explore the idea. They use a spreadsheet program to create bar graphs and perform a chi-square test. They also use provided data to...
Radford University
Exploring Equations through Life Goals
What do I want to do when I grow up? Learners research job categories and determine a career within the category. Using the chosen job, pupils find the hourly wage and calculate future income based on percentage wages. Individuals then...
US Department of Commerce
Diversity: Differences in Communities
Using census data, the class finds the percentages of three diversity categories for four states and compare them. With the assistance of a 10 X 10 grid, pupils create visual representations of a comparison between two states on one...
University of Waikato
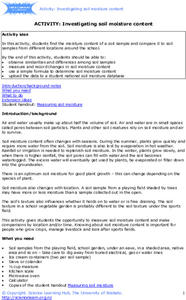
Investigating Soil Moisture Content
Class members analyze the water content in soil samples by drying out the samples and taking measurements every minute until all the moisture is gone. Scholars compare the initial weight to the dried weight to calculate the percentage of...
US Department of Commerce
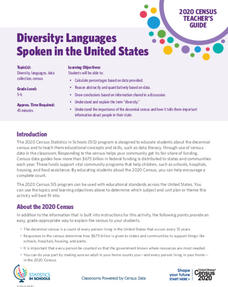
Diversity: Languages Spoken in the United States
High schoolers begin a discussion on diversity and determine the percent of the population that speak another language at home in the US. Classmates make a prediction of the percentage of people that speak another language at home in...
US Department of Commerce
How Are Single-Parent Households Distributed Across the United States?
There sure are a lot of single-parent households in the country. After selecting one of four US regions to investigate, pupils create dot plots and box plots on the percentage of single-parent households with male parents and female...
US Department of Commerce
Exploring Sampling Variability - Higher Education Attainment Across The United States
More education in statistics is always beneficial. Given cards that provide the proportion of adults with bachelor's degrees in 10 random US states, scholars individually determine the sample percentage of states in which more than 30...
US Department of Commerce
Educational Attainment and Marriage Age - Testing a Correlation Coefficient's Significance
Do women with college degrees get married later? Using a provided scatter plot of the percentage of women who earn bachelor's degrees and the median age at which women first get married over time, pupils conduct a linear regression...
US Department of Commerce
Over the Hill - Aging on a Normal Curve
Nobody is too old to learn something new. Young statisticians analyze census data on the percentage of the population older than 65 years old in US counties. They fit a normal distribution to the data, determine the mean and standard...
US Department of Commerce
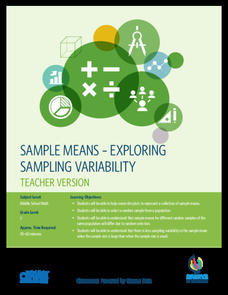
Sample Means - Exploring Sampling Variability
Sample an excellent resource on sampling variability. Pupils analyze census data on the percentage of homes in each state that have Internet access. They take random samples of different sample sizes, determine the sample means, and then...
Bowland
Security Camera
Take an overall view of percentages. Pupils determine whether a shop owner's claim is correct about what percent of his shop is viewable from the installed security camera. Learners try to find whether there is a better location for the...
Curated OER
Proportional Taxes
Students are able to define and give an example of a proportional tax and the impact that it can have on different income groups and explain how a proportional tax takes the same percentage from all tax groups.
Curated OER
Creating a Government
A simulation gives scholars a personal look at what goes into forming a government. Each of them is assigned 1 of 4 tribes which make up Borka, a hypothetical country. The tribe distribution is based on the percentage of people in each....
Curated OER
Multiplication and Areas
Upper graders solve problems involving measurement of squares and rectangles to practice multiplication skills, finding area, and calculating prices and percentages. A performance assessment is included.
Curated OER
Our Solar System - Comparing Planetary Travel Distances
NASA presents a mini-unit on distances in our solar system. It incorporates scientific concepts of gravity, mass, density, and payload while your aspiring astronauts also employ mathematics skills. They calculate speed, they determine...
Curated OER
What's Along the Coast?
Students research an area with at least one dominant geographical feature. Then they display their findings in a realistic 3-dimensional presentation. Students also prepare ancillary material to support their project. Finally, they chart...
Curated OER
Making Decisions With Probability
In this math worksheet, students investigate 6 probability problems which include percentages. Students read the story problems and answer with both numbers and word explanations.
Curated OER
Redox Titration of Iron
Students perform a redox titration of iron. In this iron titration lesson plan, students use potassium permanganate to oxidize iron so they can determine the percentage of iron in a sample of fertilizer.
Other popular searches
- Teaching Percentages
- Figuring Percentages
- Calculating Percentages
- Basic Money Percentages
- Math Percentages
- Markup Percentages
- Discount Percentages
- Decimals and Percentages
- Percentages and Math
- Math Lessons on Percentages
- Circle Percentages
- Percentages of Quantities


