Curated OER
Surveys
Students collect data from middle school survery. They tabulate percentages by grade level. They create a graph to display the survey results.
Curated OER
What's In It?
Students discover the ingredients that make chocolate. They practice reading ratios and percentages. They also examine its value in relationship to its weight.
Curated OER
TE Activity: A Merry-Go-Round for Dirty Air
Students observe a simulation of a cyclone to examine a method of pollutant recovery in cleaning industrial air pollution. They examine how engineers develop technology to reduce air pollution and determine percentages for technology...
Curated OER
Trash on Texas Beaches
Students take a field trip to a local Texas beach. Using the trash and debris they find, they classify them based on specific criteria. In groups, they calculate the total for each category and determine the percentage of each category...
Curated OER
Estimating for Accuracy
Young scholars are introduced to the topic of estimation. Using various methods, they estimate and calculate the answers with the use of a calculator. They develop a practice to always estimate answers involving percentages and use a...
Curated OER
Groundwater Resources
Students use digital maps to explore underground reservoirs. Individually, or in small groups, students access specified internet sites and research uses and locations of groundwater. Students explore the percentage of usable water,...
Curated OER
Hot Shots 2
Students simplify fractions. They convert fractions to decimals. Students comprehend the double number line and how to use it proportionately. They convert fractions to percentages using the double number line. Students use the...
Curated OER
Standard Sizes of Paper
Learners measure the dimensions of different sizes of paper. Using a copy machine, they discover dilations. After enlarging and shrinking particular copies, students examine rates, ratios and percentages and discover the relationship of...
Curated OER
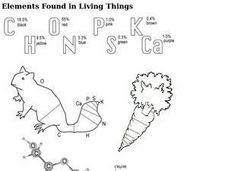
Elements Found in Living Things
In this elements worksheet, students review the most common elements found in living things. Students color in two pictures with the percentages of the elements found in that living thing.
Curated OER
Math Practice: Circles
In this circle learning exercise, students solve 8 problems: finding percentage increase, finding differences in area and perimeter, finding circumference and area.
Curated OER
Harmful Algal Blooms in Full Bloom
High schoolers calculate the total percentage of samples from the data on the graphs. In this marine science lesson, students analyze the concentration levels over a period of time. They suggest ways to lessen the effect of these blooms.
Curated OER
Probability
Eighth graders relate real life events with probability. In this probability lesson, 8th graders investigate using coin toss, discuss NBA shooting percentages and MLB batting averages. Students also complete a worksheet.
Curated OER
Changing Fractions to Percents
In this fractions to percents worksheet, learners solve 6 problems, converting fractions given to percentages. Students may click on hint or check answer buttons.
Curated OER
Parting Ways
Young scholars become part of the solution as they practice figuring percents. The number of men versus women present in the room and their heights can be used to form the basis of this investigation.
Curated OER
Lucky Number
Students use data from simulations to make theoretical generalizations. They discuss possible relationships between several given events and gain understanding about their own mathematical intuition about likelihood.
Curated OER
Selling Price
Students work independently to complete a problem solving activity that involves percent. This instructional activity is designed to be used as an assessment following a unit on percents. Students are presented with a problem involving a...
Curated OER
What Should I Wear Today?
Fourth graders examine weather data for Columbus, Ohio using an Internet resource. They complete a two day and a weekly weather charts before discussing the information. After the discussion, they answer questions about the charts...
Curated OER
From 3 To 30, By Threes
In this from three to thirty by threes worksheet, students practice completing a multiplication table utilizing only multiples of three.
Curated OER
Percent Of 2-Digit Numbers
In this percentage instructional activity, students find percentages of 10 two-digit numbers. Problems include finding more than 100% of a number.
Curated OER
Equivalent Numbers
Students work together matching numbers on index cards. They must match numbers in different forms, such a fractions and percentages. They compete with other groups in the class to get the most correct.
Curated OER
Kansas vs the U.S.
Students demonstrate an understanding of the physical and political geography of Kansas. They view maps and films to gain knowledge of Kansas. They calculate the percentage Kansas harvests for each crop out of the national total.
Curated OER
Finding the Percent of a Number in Fish Body Weight
Students use fractions to find the weight of fish. They use percentages to determine the correct amount to feed them. They organize their data into a graph and shares with the class.
Curated OER
What's Happening Below The Surface?
Students determine the soil composition of soil layers in their area. They collect soil samples, calculate the percentage soil water content, analyze data, and evaluate each site for future tree growth.
Curated OER
The Tip of the Iceberg
Students discover the percentage of an iceberg that is above and below the water surface. They compare salt water icebergs and fresh water icebergs and if they behave the same of differently. They work with their lab group to perform...
Other popular searches
- Teaching Percentages
- Figuring Percentages
- Calculating Percentages
- Basic Money Percentages
- Math Percentages
- Markup Percentages
- Discount Percentages
- Decimals and Percentages
- Percentages and Math
- Math Lessons on Percentages
- Circle Percentages
- Percentages of Quantities


