Curated OER
Schoolyard Bird Project
Students observe and count bird sightings around their schoolyard throughout the school year.
Curated OER
A Fishy Tale
Eighth graders do a research project on a particular species of Atlantic seafood and record and graph information pertaining to commercial landings of that species of seafood. They use a website and an Appleworks spreadsheet.
Curated OER
Building Boxes- Polynimial And Rational Functions
Students investigate the concepts of polynomial and rational functions. They identify the general patterns used to solve problems. The use of real world contexts in the problems helps to promote engagement and understanding of how the...
Curated OER
Off to College
High schoolers investigate linear, quadratic and exponential equations using the TI calculator. They identify relation and functions using ordered pairs, graph the data, analyze the data, and relate it to real-world situations.
Curated OER
Texting and Grades II
Given the least squares regression line, interpret the slope and intercept in the context of the relationship between texting and GPA. Although this task is short and looks simple, some subtle points can be brought to light in a...
Curated OER
Translate Word Phrases and Sentences into Equations
Use this video to show your learners an example of how to translate word phrases into an equation to solve a real-world problem. The presenter begins with a review of how to use cross products to solve a proportion, including how to do...
Curated OER
Remembering Our Veterans
Eighth graders research a variety of military statistics while using the theme of Remebering Our Veterans. They use data management to plan and create a PowerPoint presentation with their findings. They incorporate different types of...
Curated OER
Wrapping It All Up
Through learning how to examine linear, quadratic, and exponential functions, students explore the effects of changes in parameters on the graphs of linear, quadratic, and exponential functions. The lesson is designed to be a review of...
Curated OER
Stressed to the Breaking Point
High schoolers explore the relationship between the amount of weight that can be supported by a spaghetti bridge, the thickness of the bridge, and the length of the bridge to determine the algebraic equation that best represents that...
Curated OER
Which Amusement Park Would You Choose?
Students analyze data related to amusement parks and create a spreadsheet to display the data. They read the data and predict which amusement park they think is safer, create a spreadsheet and graph, and write a proposal based on their...
Curated OER
Venn Diagram and UK Basketball
Students analyze data and make inferences. In this algebra lesson, students collect and analyze data as they apply it to the real world.
Curated OER
"Measurement in Motion"
Ninth graders examine the rate of motion and changes in motion using a ramp and a rolling object. They conduct the demonstration, determine the average speed, and describe how a moving object can have zero acceleration and deceleration.
Curated OER
Exploration Sequence of Bounces
New skills are developed as students use graphing calculators and ranger technology to capture and graph the sequence of bounces a ball makes when dropped. After recording the height of four or more bounces, they use the collected data...
Discovery Education
Sonar & Echolocation
A well-designed, comprehensive, and attractive slide show supports direct instruction on how sonar and echolocation work. Contained within the slides are links to interactive websites and instructions for using apps on a mobile device to...
PBS
Toothpicks and Transformations
Students investigate quadratic functions using geometric toothpick designs. They review transformations of quadratic functions-vertical and horizontal shifts, and stretches and shrinks. Students match the symbolic form of the function to...
Curated OER
Spaghetti Graphs
Young scholars work in pairs to test the strength of spaghetti strands. They collect and graph data to determine a line of best fit. Students create a linear equation to interpret their data. Based on the data collected, young scholars...
Curated OER
Battery Power
Sixth graders examine how much energy they use in the form of battery power. They examine the cost of using regular vs. rechargeable batteries and examine the effect on the environment of the two types of batteries. They discover that...
Curated OER
Korean Table Manners
Students eat a Korean meal with proper table manners. They compare American table manners to Korean with at least 3 similarities and 3 differences. They write a brief essay and describe, list and demonstrate the proper Korean...
Curated OER
Get Your Numbers in Shape - TI-83
High Schoolers use the TI-83 calculator to produce a sequence, explore patterns and find a linear or quadratic equation for a given pattern. They use inductive reasoning to make conjectures about patterns. They find the Y-value of a...
Curated OER
Geometric Sequences and Series
Learn to calculate the nth term of a sequence defined by an algebraic expression. They examine geometric sequences and series, relate geometric sequences to their explicit forms, find the partial sums of a sequence in a table, and...
Curated OER
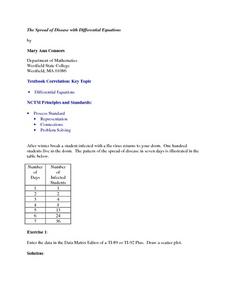
The Spread of Disease with Differential Equations
Twelfth graders solve problems using differential equations. In this Calculus lesson, 12th graders analyze data regarding the spread of a flu virus. Students use the symbolic capacity of the TI-89 to develop a model and analyze the...
Curated OER
TI-89 Activities for PreCalculus and AP Calculus
Using the TI-89 calculator, young scholars explore the statistical, graphical and symbolic capabilities of the TI-89. Students investigate topics such as solving systems of equations, finding inverse functions, summations, parametrics...
Curated OER
Properties of Logarithms
Learners explore the concept of logarithms. In this logarithms activity, students discuss the logarithm properties. Learners use linear functions as a basis to develop the logarithm properites by substituting log b and log a for x and y.
Curated OER
Celsius to Fahrenheit
Students convert degrees between two different units. In this algebra lesson, students graph linear equations and identify the line of best fit. They use their line of best fit to make predictions given a set of data.
Other popular searches
- Creating a Scatter Plot
- Scatter Plot Graphs
- Math Scatter Plots
- Scatter Plot Project
- Scatter Plot Trend Line
- Algebra Scatter Plots
- Creating Scatter Plots
- Scatter Plot Worksheets
- Correlating Scatter Plot
- Candy Scatter Plots
- Scatter Plot Notes
- Data for Scatter Plots


