Curated OER
Studying Snow and Ice Changes
Students compare the change in snow and ice over a 10 year period. In this environmental science lesson, students use the live data on the NASA site to study and compare the monthly snow and ice amounts on a map of the entire Earth. ...
Curated OER
Climate Change
Ninth graders compare the Arctic and Antarctic. In this climate lesson students work in groups, research and complete an oral report or a poster.
Curated OER
Trees: Recorders of Climate Change
Middle schoolers study cross sections of trees or tree "cookies" to discover how the rings on tree sections give clues to the climate during the time the ring was produced. They study simulated cross sections of trees to determine the...
Curated OER
PLATE MOVEMENTS AND CLIMATE CHANGE
Pupils label three geological maps with continents provided to analyze the relationships between the movement of tectonic plates and the changes in the climate. In small groups, they discuss their findings and form hypotheses about the...
Curated OER
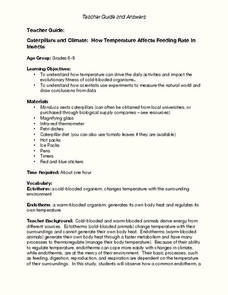
Caterpillars and Climate: How Temperature Affects Feeding Rate In Insects
Do you eat more when you are hot or when you are cold? Young scientists observe the eating pace of two caterpillars at different temperatures. The differences in endotherm and ecotherm animals' ability to adjust to temperature change...
Howard Hughes Medical Institute
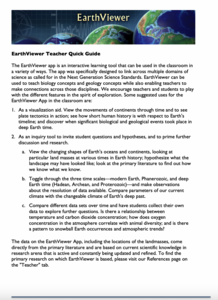
EarthViewer Climate Guide Activity
What did Earth look like 4.5 billion years ago, and what was the climate like then? Scholars explore a view of Earth throughout history. They observe continents moving, temperatures fluctuating, and huge changes in ecosystems. A learning...
Kenan Fellows
Climate Change Impacts
Turn up the heat! Young mathematicians develop models to represent different climates and collect temperature data. They analyze the data with regression and residual applications. Using that information, they make conclusions about...
Curated OER
Tread Lightly: Our Changing Climate
Students examine the concept of climate change. In this environmental studies lesson, students research Internet and print sources regarding global warming and discuss their research findings as well as their impressions.
Curated OER
Understanding Climate
Fourth graders create two dioramas out of household materials to compare the influence of various factors that impact climate. Each group discuss how the change in factors influenced the climate, flora, and fauna of their area.
It's About Time
How Do Plate Tectonics and Ocean Currents Affect Global Climate?
What do plate tectonics and ocean currents have to do with global climate? This fourth installment in a six-part series focuses on how plate tectonics and ocean currents affect global climate, both now and in the past, outlines an...
Chicago Botanic Garden
Recent Weather Patterns
Decide whether weather is changing! A two-part activity first challenges classes to review the differences between weather and climate. Once finished, individuals then analyze historical data to determine if climate change is happening...
Howard Hughes Medical Institute
Classroom Activities: EarthViewer
The spot you are standing in right now—how did it look 2,000 years ago, one million years ago, or even four billion years ago? Scholars use a model of Earth throughout history to learn about continental drift, climate change, changes in...
Curated OER
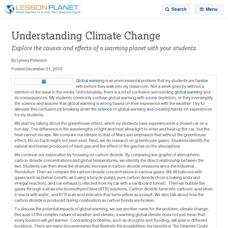
Understanding Climate Change
Explore the causes and effects of a warming planet with your students.
US Environmental Protection Agency
Carbon Through the Seasons
Meteorologists view an animated video by the Environmental Protection Agency to learn how the carbon cycle works, and then move into groups to analyze and graph actual data of the atmospheric carbon dioxide concentration from Hawaii's...
Curated OER
Developing Models
Students study the concept of a scientific model and demonstrate climate change models. In this scientific lesson students design a model using direct and indirect evidence and use it to make hypotheses.
Curated OER
Canada's Arctic Barometer
Students research arctic climates. In this Web-quest investigation, students will identify Arctic climate changes, explain the effects of these changes, relate the changes to other regions, and write their findings in a letter format.
Curated OER
Developing Models
Students understand the concept of a scientific model and how it relates to climate change. In this obsesrvation and gathering data lesson plan students design a trial and error model using PowerPoint.
Curated OER
Trapping CO2
Students investigate climate change and how the properties of carbon dioxide and methane play a part. In this climate lesson students use a chemical reaction to trap CO2 and methane.
National Park Service
It Was a Very Good Year
Waterton-Glacier International Peace Park includes whitebark pines that are over 1,200 years old, meaning they have been there since before medieval times. The second lesson of five details how to read tree rings for climate change and...
Center Science Education
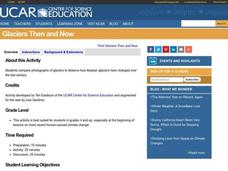
Glaciers: Then and Now
Cooperative groups compare pairs of photos of Alaskan glaciers. They match a historical photo to the recent photo of the same glacier. The class discusses what conditions are necessary for glaciers to retreat. This abbreviated activity...
World Wildlife Fund
Land of the Midnight Sun
From days of 24 hour sunlight, to endless nights that last for days, the Arctic is a very unique place to live. Examine the seasonal changes that occur in the northern-most reaches of the globe and the impact they have on the plants and...
Curated OER
Translating Science Into Public Policy
Students role-play participants at a panel on climate change. They represent either scientists or policymakers. "Scientists" use the information they've learned in other classes and assignments to present information to "policymakers,"...
Curated OER
Graphing Sea Ice Extent in the Arctic and Antarctic
Students graph sea ice data and predict long term trends in the data. In this climate change lesson, students use sea ice data from the Arctic and Antarctic to construct line graphs. They use their graphs to predict the effects of global...
National Wildlife Federation
The Tide is High, but I’m Holding On… Using ICESat Data to Investigate Sea Level Rise
Based on the rate of melting observed from 2003-2007 in Greenland, it would take less than 10 minutes to fill the Dallas Cowboys' Stadium. The 17th lesson in a series of 21 has scholars use the ICESat data to understand the ice mass...


