Curated OER
Questioning NASA
Space science and math collide in this inquiry that investigates launching times for antacid-tablet rockets! Upper elementary or middle school learners collect data as they launch these mini rockets. They apply concepts of place value...
NASA
Water Works on a Blue Planet
Keep within a water budget. Learners find out that less than 2.5% of Earth's water is available to drink—and that there is a fixed amount of water. Scholars read an interesting article comparing the available water to a game of Monopoly...
Fluence Learning
Writing an Argument: Is Electronic Communication Helpful or Harmful?
Technology has undoubtedly improved the lives of people around the world—but has it improved communication? Seventh graders read two informative passages about the rise of texting and emailing versus in-person conversations before...
Academy of American Poets
Teach This Poem: "Toward the Winter Solstice" by Timothy Steele
Timothy Steele's poem, "Toward the Winter Solstice," offers scholars an opportunity to consider what poets and scientists could learn from each other's work. First, learners examine a NASA image of a star-forming region in the Orion...
Curated OER
Mission Discovery
Learners examine the changes to the space shuttle Discovery and its history by creating a classroom exhibition about NASA's space shuttle program. They create an informative and attractive invitation about the gallery for outside visitors.
Curated OER
Student Experiment Flies On NASA Space Shuttle!
Pupils design and construct an experiment that will be launched into space aboard a NASA research shuttle. How better to gain and appreciation for (and, hopefully, a love of) scientific investigation than to do real science and be...
Multiverse
Rainbows of Light: The Visible Light Spectrum
Rainbows can teach us about the visible light spectrum. Learners observe multiple items that clearly display a rainbow to develop better connections. The lesson then explains wavelength using a rope to make waves.
Baylor College
Servings and Choices
An important part of balancing caloric intake to energy expenditure is knowing how many Calories you are consuming. In the fifth of a seven-lesson series on food and energy, learners estimate their daily caloric intake, then use a...
Curated OER
Time to lend NASA a hand
In this measurement worksheet, students complete an experiment answer questions about how they measure the units of volume, temperature, and mass of certain objects. Students answer 5 questions.
NASA
The Case of the Wacky Water Cycle
Join the tree house detectives in learning about the processes of the water cycle, water conservation, water treatment, and water as a limited resource.
Curated OER
Does cloud type affect rainfall?
Student use MY NASA DATA to obtain precipitation and cloud type data. They create graphs of data within MY NASA DATA. Students compare different cloud types, compare precipitation, and cloud type data They qualitatively describe graphs...
Curated OER
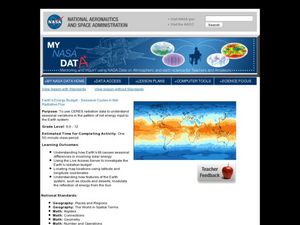
Earth's Energy Budget - Seasonal Cycles in Net Radiative Flux
Learners attempt to understand seasonal variation by viewing images of the energy received by the earth. In this weather activity, students view images from NASA of the influx of energy from the sun and make predictions about resulting...
Curated OER
Trends of Snow Cover and Temperature in Alaska
Students gather historical snow cover and temperature data from the MY NASA DATA Web site. They compare this data to data gathered using ground measurements from the ALISON Web site for Shageluk Lake. They graph both sets of data and...
Curated OER
Cold, Clouds, and Snowflakes
Students explore satellite data and graphing. In this weather data analysis math and science lesson, students analyze NASA satellite data to draw conclusions about geographical areas where precipitation might have happened. Students...
Curated OER
Differences Between Ground and Air Temperatures
Students examine the differences between air temperature and ground temperature. In this investigative instructional activity students find NASA data on the Internet and use it to create a graph.
Curated OER
Exploring the Water Cycle
The water cycle is one of earth's most easily observable processes, but demonstrating each step within classroom walls can be a challenge. Through a series of videos and quick demonstrations, cover each aspect of the hydrologic cycle in...
Curated OER
Linkages Between Surface Temperature and Tropospheric Ozone
Students use data microsets of mean near-surface air temperature and tropospheric ozone residual averages to infer patterns. Students analyze changes in tropospheric ozone and then hypothesize about the consequences of these changes.
NASA
Climate Change Online Lab
What are the key indicators that show scientists that our planet is in the fastest warming trend ever? Learners go on a WebQuest to examine the evidence for themselves. Following several links to NASA sites, kids see how the global...
Curated OER
Moon Mining
Go on a moon mining expedition from the safety of your classroom with this space exploration simulation. Using simple models of the moon's surface prepared ahead of time by the teacher, young scientists are challenged with locating and...
Curated OER
A Comparison of Cloud Coverage over Africa
Young scholars identify different climate regions and local weather patterns. For this cloud coverage lesson students use NASA satellite data and import it into Excel.
Chicago Botanic Garden
Plant Phenology Data Analysis
Scientists monitor seasonal changes in plants to better understand their responses to climate change, in turn allowing them to make predictions regarding the future. The last activity in the series of six has scholars analyze BudBurst...
Curated OER
The Fabled Maine Winter
Learners graph and analyze scientific data. In this research lesson plan students use the Internet to obtain data then draw conclusions about what they found.
Curated OER
Identifying Ozone Variations over Different Locations
Learners analyze ozone data. In this atmosphere lesson, students will use a NASA resource to gather data for different regions of the Earth. Learners will then create a graph for their data and answer related questions.
Curated OER
History of Flight Timeline Activity
Scholars are introduced to the significant events that led to the development of today's modern forms of air travel. They create a timeline to identify the vital events that are related to man's flight. In addition, they research various...


