Curated OER
Measuring Larval Growth and Development
Students keep a detailed records of the growth and development of their larvae. They fill out an observation chart every day during the larval stage, and every4-5 days during the pupa stage. They summarize all of their data on a class...
Alabama Learning Exchange
Weather Detectives
Second graders make weather observations and record data. They use the internet to get data on the weather. After 5 days students predict the weather for the next 3 days.
Curated OER
Are There Too Many Elk?
Students study elk populations in Arizona. In this data lesson students read an article on monitoring elk populations, analyze data and make management recommendations.
National Museum of Nuclear Science & History
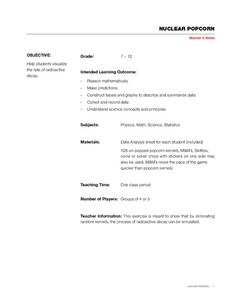
Nuclear Popcorn
Make your lesson on radioactive decay pop with this lab exercise. Using popcorn kernels spread over a tabletop, participants pick up all of those that point toward the back of the room, that is, those that represent decayed atoms. As the...
Willow Tree
Data Sampling
Some say that you can make statistics say whatever you want. It is important for learners to recognize these biases. Pupils learn about sample bias and the different types of samples.
Curated OER
Investigation 6 - Collecting Weather Data
Fourth graders collect data for two weeks. They start seeing patterns and make predictions. They can predict what the weather be like the next day and for the next few days. They see if their predictions were correct from the previous day.
Curated OER
Permafrost
Students use a thermometer to analyze soil temperature data to determine which soil sample is normal, and which one is permafrost. In this permafrost lesson plan, students participate in a hands on activity where they identify the active...
Curated OER
Ready, Set, Drift!
Students define data, recover data from the Internet, and use information they obtain to solve problems. In this investigative instructional activity students answer questions on a worksheet and demonstrate the use of a maneuvering...
Curated OER
Tables, Charts and Graphs
Students examine a science journal to develop an understanding of graphs in science. In this data analysis lesson, students read an article from the Natural Inquirer and discuss the meaning of the included graph. Students create a...
Curated OER
Tossing a Number Cube-- Tally Marks
In this math learning exercise, students investigate probability by tossing a number cube 20 times and recording the times that it lands on each number. Tally marks are used to record data. Students then participate in an experiment in...
Curated OER
Paper Airplanes and Scientific Methods
In this scientific method and paper airplanes worksheet, students go through the steps of the scientific method to determine which paper airplane design is best. They complete 8 steps of the scientific method including stating the...
Curated OER
Scatter Plots
Seventh graders investigate how to make and set up a scatter plot. In this statistics lesson, 7th graders collect data and plot it. They analyze their data and discuss their results.
Curated OER
Identification of Different Compounds and Substances
High schoolers conduct a series of tests to identify unknown compounds. In this chemistry lesson, students compare the physical and chemical properties of substances. They collect data and formulate a conclusion.
Curated OER
Measure Twice
Learners measure a variety of objects using the appropriate measuring tool. In this measurement lesson, students explain the importance of accuracy and precision in collecting data. They discuss the difference between the two.
Curated OER
Parts Are Parts: The English Measurement System
Third graders view and measure common body parts to find a fathom, a span, and inch. They discuss the historical information about how standard English measurements came to be and why body parts can no longer be used as a standard...
Discovery Education
Sonar & Echolocation
A well-designed, comprehensive, and attractive slide show supports direct instruction on how sonar and echolocation work. Contained within the slides are links to interactive websites and instructions for using apps on a mobile device to...
GoSoftWorks
GoSkyWatch Planetarium for iPad - The Astronomy Star Guide
Digital compass alignment enables navigation of the skies with true orientation at any time. Just point to the sky or "aim for the stars!" This application acts as a virtual telescope, allowing you to zoom in on any object that is...
Southern Nevada Regional Professional Development Program
Researching and Writing
Designed for teachers, this resource identifies problems learners face when attempting a research project and approaches instructors can use to help their class members overcome these obstacles. Suggestions are included for how to help...
Curated OER
Epidemiology: Graphing and Analyzing Health Data
Students graph data on fetal and infant mortality rates collected by the Centers for Disease Control and Prevention. They identify trends in the data and propose potential causes for the trends.
Curated OER
Using Math Concepts to Collect and Document Specimens
Students determine the length and width of leaf samples to the nearest millimeter and the circumference of trees. They participate in a discussion about the importance of collecting specimens carefully. They compile accurate...
Curated OER
Thank You... Thomas Edison!
Pupils investigate the life of Thomas Edison. They research how he made a difference. They understand that accurate data collection is important for math. They create a chart using spreadsheet data.
Teach Engineering
Density Column Lab - Part 1
Mass and density — aren't they the same thing? This activity has groups use balance beams and water displacement to measure several objects. The pupils use the measurements to calculate the density of the objects.
Curated OER
You're the Scientist
Students explore ways to assess the accuracy and reliability of data reported by Journey North observers.
Curated OER
Graph the Presidents At Inauguration- How Old Were They?
Students construct a graph of the presidents' ages at inauguration. In this U.S. history lesson, students use online resources to gather data about the presidents and accurately present their results on a graph.


