Curated OER
Seed Growth
Students develop an independent procedure to investigate the germination of two types of seeds. Students must construct data tables or charts to record observations and results, graph the data, and analyze the data.
Curated OER
What Part of the Earth's Surface is Covered by Oceans?
Third graders investigate oceans. In this Earth science lesson, 3rd graders predict how much of the Earth's surface is covered by oceans. Students determine if their predictions are accurate by throwing a globe to each other and then...
Curated OER
Word Power
Fifth graders identify a set of data from a real world problem. For this statistics lesson, 5th graders identify the range, mode, median and mean using some manipulatives. They write words randomizing the letters.
Curated OER
Water Cycle: Weather Lesson 1
First graders go on a water walk, collect weather data, and measure rainfall for a month. They examine the water cycle in this series of lessons.
Curated OER
Population Density
Students use the scientific method to conduct an experiment and use varied methods to gather background information. They correctly use lab equipment and prepare tables and graphs that organize, conclude, and present their findings. ...
Curated OER
Coho Salmon Enhancement
Students build a fish trap across a small stream. The purpose of the trap is to collect baseline data of Oncorhynchus kisutch, Coho salmon, smolt numbers coming out of a spring-fed pond. Other biological data also be measured.
Curated OER
Graphing Fun In Third Grade
Third graders display information in a graph, table, and chart. In this data lesson plan, 3rd graders look at graphs, tables, and charts, discuss their importance, and make their own.
Curated OER
Understanding Weather Maps and the Importance of StormT
Young scholars explain how storm tracking is important to understanding sources of acid rain pollution. The read and explain a weather map. They set up plastic or glass collection container for rain in an open area away from buildings...
Curated OER
Sampling Rocks
Students examine rocks. In this geology lesson, students collect rocks from the schoolyard and classify them by color, weight, and size. Students use a rock guide to identify each of the rocks.
Curated OER
Mean, Median, and Mode
Young scholars calculate measures of central tendency. in this mean, median, and mode lesson, students calculate the measures of central tendency. They organize data, examine and explain the statistics.
Curated OER
Heat Loss
Students comprehend how heat loss is affected by exposed surface area. They decide what type of and how many data to
collect. Students decide how the results should be presented. They make a series of accurate observations
Curated OER
Protecting Habitats and Species
Students recognize that scientists continuously gather and interpret data to understand and predict relationships among natural phenomena. They research various volcanoes and plot the volcano locations on a world map.
Curated OER
Virtual Field Trip: Lodging and Meals
Students calculate the costs for lodging and meals for a virtual field trip. They calculate the number of nights lodging needed for road and city travel and the number of meals needed, the costs for each, and input the data using...
Curated OER
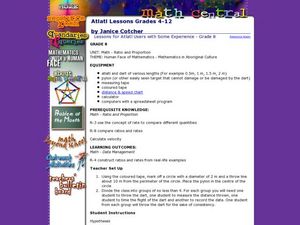
Atlatl Lessons for Grade 8
Eighth graders explore the weapons of the Aboriginal people. In this eight grade math/science lesson, 8th graders collect and analyze data regarding the speed and distance of a dart thrown with an atlatl. Students choose the...
Curated OER
Lesson 3: Life Cycle of Brassica Plants
Students investigate the life cycle of brassica plants. In this science lesson, students observe each stage in the life cycle of their plant. Students record their observations and graph the data. Students
Curated OER
"Weather" or Not?
Students complete a three week unit about weather and how it affects our behavior. They read and discuss various books related to weather, conduct an experiment about the tilt of the earth, plan a field trip based on temperature,...
Curated OER
Creating a Spreadsheet
Students create a spreadsheet using ICT. In this algebra lesson, students collect and graph their data using a spreadsheet. They find solution to a given problem using trial and error.
Curated OER
Travel Time
Students use a migration map to estimate the distance traveled by a bird while migrating south. After calculating accurate estimates of the distance traveled, students compare the distances traveled with the amount of time elapsed.
Curated OER
Chew on This
Eighth graders explore and demonstrate the seven steps of the scientific method. They predict how much sugar is in chewing gum and test, analyze, and calculate the sugar content of gum.
Curated OER
Handboiler Lab
Students participate in a handboiler experiment, using a sealed glass vial filled with alcohol. They record the data and do averages and see if there is a difference between a boiler and a non-boiler.
Curated OER
Weather It's Right or Not
Fifth graders explore weather forecasting. For a week, 5th graders observe weekly weather forcasts on different television channels. They predict which station is more accurate with their predictions. Students record and chart...
Curated OER
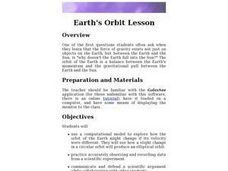
Earth's Orbit Lesson
Tenth graders devise a computational model to explore how the orbit of the Earth might change if its velocity were different. Using accurately recorded data, 10th graders defend a scientific argument.
Curated OER
Cloud Database
Students research information on the types of clouds. They create a database and use a formula. They create various reports and access electronic information to obtain accurate pressure and temperature readings from the National Weather...
Curated OER
Dating Practices
Students interpolate, extrapolate, and make predictions from given information. They present results and conclusions from given data using basic statistics. Pupils create a survey from a critical question and decide which sampling...


