Code.org
Cleaning Data
"Clean the data!" "I did not know it was dirty." Introduce your class to the process of cleaning data so that it can analyze it. Groups work through a guide that demonstrates the common ways to filter and sort data. Pairs then...
Code.org
Discover a Data Story
"Data is so boring, there's no way to find any patterns in them." Or is there? Pairs investigate data sets using different data visualization tools to discover a trend that may exist in a data set. Once they find a trend or pattern,...
Curated OER
Arthropod Data Collection
Students describe the life cycle of various bugs as well as their predators and feeding habits. The class participates in a discussion of the various methods scientists use to gather data including research and experiment. After...
NOAA
Ground-truthing Satellite Imagery with Drifting Buoy Data
Ground-truthing ... is it even a word? The last installment of a five-part series analyzes how scientists collect sea surface temperature data. Scholars use government websites to compare temperature data collected directly from buoys...
Curated OER
Are You Full of Hot Air?
Explore the concept of measuring and recording circumference. In this physical science and measurement lesson, young learners blow up balloons, measure the circumference, and record the data on an interactive graphing website.
Kenan Fellows
Saving Those Who Save Us: Exploring the Use of Sensors with Data Visualization
Sensor technology is amazingly accurate and useful. Combining the sensor technology and mathematical knowledge, scholars design experiments to answer a question they have developed. Questions may focus on light sensing, temperature...
Polar Trec
How Much Data is Enough?
The next time you read a magazine or watch the news, make note of how many graphs you see because they are everywhere! Here, scholars collect, enter, and graph data using computers. The graphs are then analyzed to aid in discussion of...
Curated OER
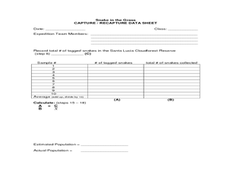
Snake in the Grass: Capture/Recapture Activity
Learners estimate the total number of species in Ecuador using the capture/recapture method. They collect data about each species and act as members of a science expedition to determine the total number of species by using mathematical...
Statistics Education Web
When 95% Accurate Isn’t
Investigate the effect of false positives on probability calculation with an activity that asks scholars to collect simulated data generated by a calculator. To finish, participants analyze the probability of certain outcomes which lead...
Statistics Education Web
Population Parameter with M-and-M's
Manufacturers' claims may or may not be accurate, so proceed with caution. Here pupils use statistics to investigate the M&M's company's claim about the percentage of each color of candy in their packaging. Through the activity,...
Curated OER
Data-gathering Activities Relating to Trees in Their Environment
Students gather data relating to trees in their environment. In this biology lesson plan, students determine heights of trees and their ages. A canopy map will indicate optimal growing areas for the tree.
Curated OER
Measurement of Biotic and Abiotic Objects
Students identify biotic and abiotic factors. In this environmental study lesson plan, students conduct a series of experiments to collect and record data and draw conclusions based on the results.
American Institutes for Research
Digital Smiles
Explore metric measurement, recording data, and creating an electronic spreadsheet displaying results with your math class. Scholars will measure the length of their smiles, record the measurements, and represent the results on an...
Virginia Department of Education
Work and Power
Assist your class with correctly calculating the values for force, work, and power as they determine the amount various activities require. They gather data and participate in a group discussion to compare results upon conclusion of the...
Messenger Education
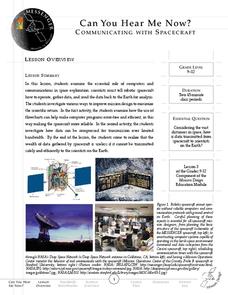
Can You Hear Me Now?—Communicating with Spacecraft
Radio signals transmitted to Pluto take five hours to reach their destination! In these two activities, young scientists explore data communication in space. In activity one, pupils learn how data is gathered and sent back to Earth....
Curated OER
China's Population Growth
Learners collect data from China's population growth and determine the mean, median, and mode from the data. In this data lesson plan, pupils determine probabilities and use them to make predictions.
Curated OER
The Power of Graphical Display: How to Use Graphs to Justify a Position, Prove a Point, or Mislead the Viewer
Analyze different types of graphs with learners. They conduct a survey and determine the mean, median and mode. They then identify different techniques for collecting data.
Curated OER
Critter Encounter Chart
Students record data found at an assigned web site. In this data collection lesson, students access an assigned web site in order to complete a data chart about animals they see. They travel to different sections of the web site to find...
Curated OER
Bird Feeding and Migration Observation
Students research bird migration and build a bird house. In this bird lesson plan, students research the birds in their area and where they migrate to. They also build their own bird house and record data on what kinds of birds come to...
Curated OER
Are There Too Many Elk?
Students use information about elk populations in Arizona to make recommendations about population management. In this ecology lesson, students discover the problems associated with having a heard of elk that is too large. After...
EngageNY
Sampling Variability in the Sample Mean (part 1)
How accurate is data collected from a sample? Learners answer this question using a simulation to model data collected from a sample population. They analyze the data to understand the variability in the results.
Curated OER
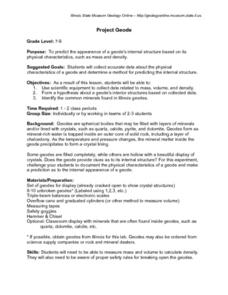
Project Geode
Young geologists attempt to predict the appearnace of a geode's internal structure based on how it looks from the outside, its mass, and its physical characteristics. In this geologly instructional activity, learners use scientific...
Curated OER
The Fat and the Lean
Students collect data on calorie intake. In this algebra lesson plan, students use the collection of data to make better eating decisions. They investigate the nutritional value in food using a graph and draw conclusion from their findings.
Curated OER
Explore: Collect And Organize Data
In this exploring how to collect and organize data worksheet, young scholars, working with a partner, problem solve the answers to seven word problems involving data.


