University of Minnesota
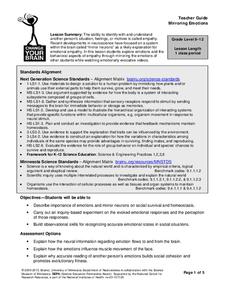
Mirroring Emotions
Do you ever give your class the "teacher look"? Without saying a word, they become silent and engaged (hopefully). How do they know what you're thinking? Explore the concept of nonverbal communication and how it relates to our...
Curated OER
Using MY NASA DATA to Determine Volcanic Activity
Students explore how aerosols are used in science to indicate volcanic activity and how biomass burning affects global aerosol activity. Students access data and import into MS Excel using graphical data to make inferences and draw...
Curated OER
USING MICROSOFT, POWERPOINT, WORD, EXCEL AND THE INTERNET TO CREATE A PRESENTATION
Explore the basic PowerPoint commands and options. They research information (including the WWW) related to an approved topic for presentation development. They create a presentation defined by specific criteria. They document research...
Curated OER
Viewpoint on Causes of Global Warming - An Assignment Using Anonymous Electronic Peer Review With a Dropbox
Students are told that studies exist that suggest human activities are not causing warming of the Earth. Students are given the opportunity to further their writing, critical thinking and reasoning skills. While enhancing their computer...
Cornell University
Nano Interactions
Tiny particles can provide big learning opportunities! Middle school scientists explore the world of nanoparticles through reading, discussion, and experiment. Collaborative groups first apply nanotechnology to determine water...
Workforce Solutions
Miniature Gulf Coast Project
Scholars show what they know about data collection and analysis with an activity that examines a smaller population of Houghton, Texas. Independently or in pairs, learners identify their research question, gather, graph, and analyze...
Cornell University
Fibers, Dyes, and the Environment
Nanofibers can be made through electrospinning or force spinning in order to reduce the negative impact on the environment. Pupils study the role of fibers and dye on the environment through a series of five hands-on activities. Then,...
Curated OER
Ranging the Triple M's
Fifth graders explore collecting and analyzing data. In this mean, median and mode lesson, 5th graders use real word data to determine the mean, median and mode. Students are given sets of numbers on index cards as asked to find the...
Curated OER
Making the Most of the Internet
Children listen as the teacher tells them about Childnet. Students use the CD-ROM and internet sites to answer questions on the worksheets. Students learn to navigate the sites and search techniques. If time and interest allows, an...
Cornell University
Glued into Science—Classifying Polymers
Explore the unique characteristics of polymers. A complete lesson begins with a presentation introducing polymers. Following the presentation, young scientists develop a laboratory plan for creating substances using polymers. They...
NASA
Geographical Influences
"If global warming is real, why is it so cold?" Distinguishing the difference between weather and climate is important when it comes to understanding our planet. In these activities, young scientists look at the climate patterns in a...
Michigan Sea Grant
Water Quantity
It may be tricky for a young mind to conceptualize that less than 1% of all water on earth is useable for humans to drink. Simulating the amount of fresh water available on earth by removing measured amounts of water from a five-gallon...
Curated OER
Using My Nasa Data To Determine Volcanic Activity
Students use NASA satellite data of optical depth as a tool to determine volcanic activity on Reunion Island during 2000-2001. They access the data and utilize Excel to create a graph that has optical depth as a function of time for the...
Curated OER
Data Analysis and Probability: Graphing Candy with Excel
Collect and graph data using Microsoft Excel with your math class. They will make predictions about the number of each colored candy in a bag of M&M's, then sort, classify, count, and record the actual data before using Excel to...
Curated OER
TE Activity: The Boxes Go Mobile
Young scholars create a mobile of boxes and cubes that they made in a previous lesson that can be accessed from this page. They design the mobile using method that an engineer would use to balance the items based on surface areas and...
Curated OER
Explore Learning Exponential Functions
High schoolers graph exponential equations and solve application problems using exponential functions. They re-enact a story about a peasant worker whose payment for services is rice grains doubled on a checker board. They place M &...
Curated OER
Exponential Functions
Students graph exponential equations of the form y=Ma. They understand the effects of M, a, and k on the graph. They solve application problems using exponential functions.
Curated OER
Our Savage Planet in the News
Students explore extreme earth phenomenons. In this savage planet lesson, students explore and report on various types of severe weather and earth phenomenons using the Internet, a word processor, or other multimedia device.
Curated OER
Volcanic Activity in the U.S.
Students locate and map ten volcanoes in United States, create chart comparing volcanoes by last eruption, type of volcano, location, and interesting fact, and create Powerpoint slide show describing basic
information about volcanoes and...
Curated OER
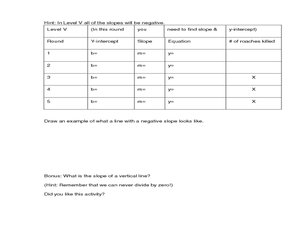
Cockroach Slope
Young scholars identify the slope of linear functions. In this slope lesson, students collect data and graph it. They write equations with no more than two variables and use technology to explain their data.
Workforce Solutions
Reality Check
Scholars complete the Reality Chech handout that identifies their potential salary given a specific profession. Pupils examine the lifestyle options and choose what they wish to have; however, each item costs money and, depending on how...
Curated OER
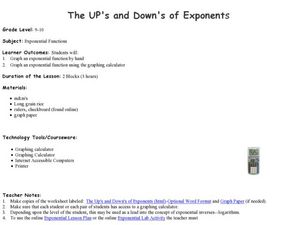
The UP's and Down's of Exponents
Students explore the concept of exponents. In this exponential functions worksheet, students complete provided worksheets that require them to graph exponential functions by hand as well using graphing calculators.
Curated OER
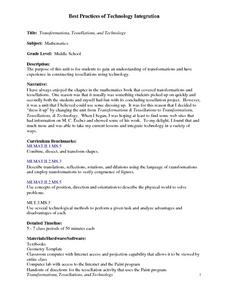
Transformations, Tessellations, and Technology
Middle schoolers complete a unit about transformations and tessellations. They explore various tessellation websites, determine which shapes tessellate, complete a log about which website activities they complete, and create a...
Alabama Learning Exchange
Flutter By, Butterfly!
Students examine the basic characteristics of butterflies. They view a butterfly PowerPoint presentation, complete various labelling activity sheets, explore websites, and design a poster that includes facts and illustrations to be used...


