Mathematics Vision Project
Module 9: Modeling Data
How many different ways can you model data? Scholars learn several in the final module in a series of nine. Learners model data with dot plots, box plots, histograms, and scatter plots. They also analyze the data based on the data...
US Department of Commerce
Commuting to Work: Box Plots, Central Tendency, Outliers
Biking may be an outlier. Using data from 10 states on the number of people reporting they bike to work, pupils calculate the measures of center. Scholars determine the range and interquartile range and find which provides a better...
EngageNY
Differences Due to Random Assignment Alone
It takes a lot of planning to achieve a random result! Learners compare results of random assignment, and conclude that random assignment allows results to be attributed to chance. They also realize the set of random means are clustered...
Yummy Math
Which is the Best Deal on Candy?
Buying enough candy for trick-or-treaters without spending a lot of money can be the ultimate Halloween trick. Middle schoolers solve two holiday-themed word problems to determine which brand of candy is the better deal, based on cost...
Curated OER
How Credit Card Interest Works
Students experiment with an Excel spreadsheet model that demonstrates the effects of interest on payments. They calculate actual costs, interest paid, and time necessary to pay off credit purchases and draw conclusions about the...
Curated OER
Measuring Area: Sensible Flats
Here's how to calculate the areas of polygonal figures. In this measuring area lesson, upper graders use hash marks to create and count square units. They also problem solve a cyberchase activity watching Quicktime videos.
Computer Science Unplugged
Lightest and Heaviest—Sorting Algorithms
How do computers sort data lists? Using eight unknown weights and a balance scale, groups determine the order of the weights from lightest to heaviest. A second activity provides the groups with other methods to order the weights. The...
EngageNY
Modeling Relationships with a Line
What linear equation will fit this data, and how close is it? Through discussion and partner work, young mathematicians learn the procedure to determine a regression line in order to make predictions from the data.
Sea World
Seals, Sea Lions, and Walruses
Learn about the mammals of the sea with a lesson about seals, sea lions, and walruses. Kids study the characteristics of each pinniped with flash cards and information, and then analyze data about elephant seals, measure heat loss in...
Curated OER
Recognizing and Extending Number Sequences
Kids work to recognize and extend number sequences. They determine the rule in order to find the missing number in each sequence given. They review the concept, practice finishing sequences with a calculator, and explain each rule.
101 Questions
Thanksgiving Taters
What would a meal be without the taters? The question is, how long does it take to peel those potatoes? Given the rate of peeling one potato, scholars predict the time it takes to peel the bag. The twist is that the first potato was...
Curated OER
Reflecting a Triangle in the Coordinate Plane
Learners explore geometric concepts using technology. They manipulate the TI to find important math topics. This activity requires a TI-84 or higher.
Curated OER
Sign of the Derivative
Learn how to investigate the change in a graph by dragging the cursor to observe the change in the function. They use the TI calculator to graph their parabola.
Houston Area Calculus Teachers
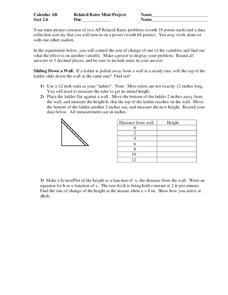
Related Rates
Use a hands-on approach to exploring the concepts of related rates in your AP Calculus class. Individuals explore the effect of the rate of change on a variable related to a variable they control. After analyzing the data they collect,...
Mathematics Assessment Project
Discovering the Pythagorean Theorem
Young mathematicians join the ancient order of the Pythagoreans by completing an assessment task that asks them to find the area of tilted squares on dot paper. They then look at patterns in the squares to develop the Pythagorean Theorem.
Bonneville
Replacing Fossil Fuels?
Burn through a lesson on fossil fuels. Pupils start a unit by considering why it is difficult to phase out fossil fuels. Using provided data on the energy densities and efficiencies of different fuels, they calculate the number of miles...
Curated OER
Graphing Quadratic Functions
Pupils explore quadratic functions in this algebra lesson. They investigate transformation of quadratic functions using the TI calculator. They use the vertex form for this lesson.
Curated OER
Transformations of Functions 2
Solving problems on the TI graphing calculator can be quite easy. Students observe the properties of transformation of functions and create a formula for the transformation.
Curated OER
Exponential vs. Power
Pupils differentiate between exponential and power functions. They identify the base, exponent and properties of exponential functions. They also graph the functions using the TI calculator.
Curated OER
Euler's Method Introduction
Young mathematicians define and use Euler's method to solve problems in this calculus lesson. Learners visualize graphs and solve differential equations. They create these visuals on the TI calculator.
Curated OER
Decimals, Percent and Scientific Notation
In this decimals, percent and scientific notation worksheet, 9th graders solve various types of problems that range from shading an indicated part of a shape to calculating using scientific notation to express their answer. They express...
Curated OER
Area and Perimeter Activities
Read this article before you begin teaching geometry! It gives teachers some insight into the world of teaching geometry to young learners, and four area and perimeter lessons are attached.
Curated OER
Calculating Elapsed Time
Students calculate elapsed time in a series of activities. In this calculating time lesson, students view a Cyberchase video that demonstrates how to calculate elapsed time. Activities include counting, subtracting and regrouping in base...
Curated OER
The Christmas Shoppe: Money Activity
In this Christmas money activity instructional activity, students use a chart of Christmas Shoppe Sales to answer 4 questions involving estimating, calculating, finding mean and sales amounts.


