Curated OER
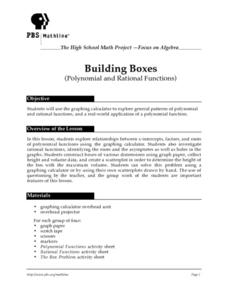
Building Boxes- Polynimial And Rational Functions
Students investigate the concepts of polynomial and rational functions. They identify the general patterns used to solve problems. The use of real world contexts in the problems helps to promote engagement and understanding of how the...
Curated OER
Turn Up the Volume
Measuring volume can be a mystery for 5th graders, but this hands-on activity gives the gift of discovery. The volume of simple rectangular solids and irregular shapes are calculated through various methods including displacing liquid in...
Curated OER
Slippery Slope
Middle schoolers use a computer to complete activitites about slope. They find the slope of mountains, roofs, and stairs using rise over run. Pupils are shown different types of slopes and have to identify if the slope is positive,...
Curated OER
Mean and Standard Deviation
Get two activities with one activity. The first activity, is appropriate for grades 6-12 and takes about 20 minutes. It introduces the concept of measures of central tendency, primarily the mean, and discusses its uses as well as its...
Curated OER
Digger and the Gang
Help online friends Digger and Sprat from the BBC series to solve math problems! In a series of activities, your class will use data sets to calculate measurements, averages, means, and probabilities. The class completes worksheets and...
Curated OER
Graph It
Elementary and middle schoolers engage in a lesson of graphing in quadrant I of the coordinate plain. They use the graph to create shapes and symbols. While using a graphing calculator, they locate the points on the coordinate plane. In...
Curated OER
The UP's and Down's of Exponents
Students explore the concept of exponents. In this exponential functions worksheet, students complete provided worksheets that require them to graph exponential functions by hand as well using graphing calculators.
Curated OER
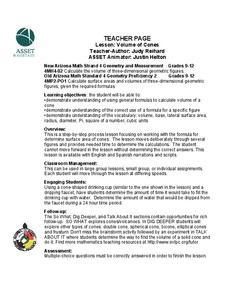
Volume of Cones
Students identify the volume of cones and pyramids. In this geometry lesson plan, students derive the formula for cones and pyramids. They calculate the volume of cones and other three dimensional shapes.
Curated OER
The Pythagorean Theorem Lesson 2
Learners discuss and review examples of the Pythagorean Theorem using a GSP, Geometer's Sketchpad, activity.
Curated OER
Simple Probability
Students explore simple probability. Each student spins a spinner and records the result as they enter the room. The recorded results are used to calculate experimental probabilities. After the teacher explains how to calculate...
Curated OER
Lesson 2 Ordering Numbers
Math wizards begin the lesson by comparing and ordering rational numbers. Using a number line, they discover the relationship between the numbers and practice ordering them in the correct way. They also review proper techniques for...
Utah Education Network (UEN)
It's All Just Similar to Me
Middle schoolers explore the concept of similar figures. In this similar figures lesson, pupils calculate scale factors of similar triangles. They find missing sides of triangles, and measure angles using protractors and measure sides of...
Curated OER
Minnesota-China Connections:What Time Is It?
Students calculate the time difference between Beijing, China and their local community. They discuss how time difference affects intercultural communication.
Curated OER
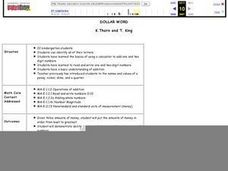
Dollar Word
Students review the value of coins prior to adding up values to equal one dollar. Letters of the alphabet are assigned monetary values and students use calculators to add up the value of a word. Students work with a partner to try and...
Curated OER
Exploring Similarity Using Scale Drawings
Learners explore scale factor as they create a scale drawing of a box, then determine the surface area and volume of the original and the scale drawing. The one page worksheet contains activities and procedures with four questions.
Illustrative Mathematics
SAT Scores
If you earned a score of 610 on the math portion of the SAT, what would be your percentile ranking? Given the mean and standard deviation of normally distributed data, find the probability of getting a particular score, or that your...
Curated OER
Applying Central Tendency
Twelfth graders calculate the mean, median, and mode of various wages. They apply these skills to asking for pay raises. They discuss whether the mean, median, or mode provide the highest wage increase.
Curated OER
You Are The Farmer
Learners investigate the farming business and occupations in agriculture. Basic multi-step math operations are performed in calculating some of the expenses involved in farming.
Curated OER
Games for Probability: In-Class and Powerball Simulation
Your soon-to-be statisticians play a game to understand the difference between independent and dependent experiments and probability. They draw colored cubes from a bag and then, by either replacing the cube in the bag, or not, for each...
Curated OER
Square Roots Using a Carpenter's Square
Students calculate the square root of a given number using carpenter's square measurements. In this math lesson, students relate this method on the Pythagorean theorem. They answer practice problems after the exploration activity,
Curated OER
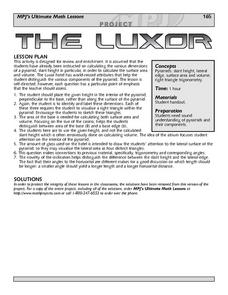
The Luxor - Pyramids, Surface Area & Volume
Students investigate the surface area and volume of the Luxor Hotel in Las Vegas. They calculate the slant height, lateral edge, and diagonal length of the base. Using this information, students explore other areas of the hotel, such as...
Curated OER
"Lucky Charms": Interpreting Data and Making Predictions
Seventh graders determine if a "lucky charm" will increase their chances of winning a game. Students calculate the experimental probability of each player in a game. They observe and collect data from each activity. Students compare the...
Curated OER
Trip to the Greenbrier
Tenth graders explore the Greenbriar Resort. In this budgeting lesson, 10th graders plan and calculate the cost of trips from their home to the Greenbriar Resort.
Curated OER
Horatio's Ratios
View a PBS video entitled Horatio's Drive and explore Horatio's Ratios. Collaborative learners form groups to use Mapquest to determine distances covered. They generate the mathematical averages, ratios, and rates in order to calculate...


