Raytheon
Just Measure It
In this line segments and angles instructional activity, students solve problem solving problems and multiple choice questions about line segments and angles. Students complete 7 pages of problems.
Illustrative Mathematics
How Much is a Penny Worth?
Are pennies really worth one cent? Here, learners use rates to calculate the price per pound of copper that would result in pennies that are exactly one cent's worth of copper. Might work best as a group or whole-class activity since the...
Illustrative Mathematics
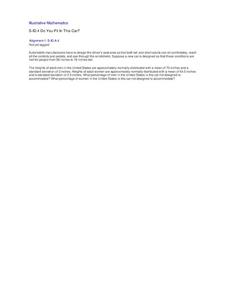
Do You Fit In This Car?
A short activity that focuses on the normal distribution as a model for data distribution. Using given means and standard deviations, your budding statisticians can use statistical tables, calculators, or other statistical software to...
Illustrative Mathematics
Words to Expressions 1
Designed as a follow-up to the lesson plan titled Watch Out for Parenthesis 1, this activity asks young learners to write an equation for the calculation described with words rather than numbers and symbols. The treasure that 5th graders...
Curated OER
Coconut and Chocolate Chip Passover Macaroons
Recipies are a natural medium for using fractions in real-world problems. This delicious activity has learners adapting the ingredients for coconut and chocolate chip macaroons, a Passover treat, for fewer and more cookies than the...
Curated OER
And You Thought Gasoline Was Expensive!
Students carry out a cost analysis. In this comparative math lesson, students compare the cost of equal measures of gasoline to mouthwash, house paint, fruit juice, white-out, and other liquids.
Curated OER
Exponents
Students recognize the proper use of exponents in mathematical expressions. They calculate expressions with the intention of comprehension of the principle of repeated factors can be expressed as powers.
PBS
Surface Area and Volume
You and your class will like this lesson plan on using visual models to relate the volume and surface area of solid shapes. Learners construct three-dimensional forms using nets. They calculate the surface area and volume for each and...
Curated OER
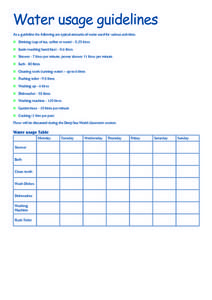
Water Usage Guidelines
In this environmental awareness and math worksheet, students calculate their total water use in a week. Students first read a chart which lists the amount of water (in litres) used for 15 activities. Students write the number of litres...
Math Ocean
Fraction Word Problem Worksheets
There are actually several math topics covered by this set of problems. First is the addition of fractions and mixed numbers with both like and unlike denominators. Nine word problems are provided after some whole class practice.There...
Curated OER
What's Your Average? What Do You Mean? I'm More Than Just Average
Upper grade and middle schoolers collect data, analyze and interpret the data. This three-part lesson plan should provide learners with a firm understanding about the differences between mean, median, and mode and how to perform the...
Curated OER
ExplorA-Pond: 4th Grade Perimeter Estimation
Your geometers are used to finding the perimeter of a square or rectangle, so give them something different this time! With this lesson, small groups will receive a picture of a shoreline and calculate the perimeter. The website listed...
Curated OER
I Will Meet You In The Middle
Students use the 50 States Quarter Reversal as a context of learning a curriculum concept based from the state of Utah. They research the concepts of cause and effect. Also, they use customary units of measurement to find length and...
Curated OER
Measuring the Volume of Water Discharge for a Stream or Canal
Students study how to measure and calculate the volume of water flowing down a stream or canal and use simple tools to make measurements. Next, students determine how many people cold live off the volume of water measured. Finally, they...
Curated OER
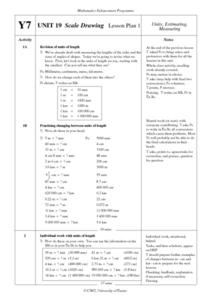
Scale Drawing Lesson Plan
Students calculate actual building measurements from a village map using concepts of ratios and scale in this ten lesson mini-unit. They practice measuring angles, multiplying decimals, estimating height and length, and converting metric...
Curated OER
Moving Day!
Eighth graders continue their geometry unit by focusing on volume. Using data, they create a spreadsheet, estimate and calculate volume. They solve real-life problems and round their answers to the hundredths place. They also practice...
Curated OER
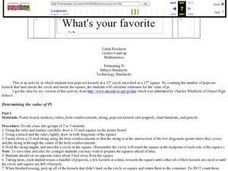
What's your favorite pi?
Sixth graders toss popcorn kernels at a 12? circle inscribed in a 12? square. By counting the number of popcorn kernels that land inside the circle and inside the square the students calculate estimates for the value of pi.
Curated OER
Forestry and Forestry Products
High school and college learners identify forestry career opportunities. They identify the parts of a tree cross-section and trees based on their leaves and characteristics. Pupils calculate board feet and explain safe methods of...
Curated OER
Off to College
High schoolers investigate linear, quadratic and exponential equations using the TI calculator. They identify relation and functions using ordered pairs, graph the data, analyze the data, and relate it to real-world situations.
Curated OER
Classroom Supplies
Challenge young mathematicians to buy classroom supplies by staying within the means of a $1,000 budget. The mathematical activity provides learners with the opportunity to decide what items from the supply list would benefit a class of...
Curated OER
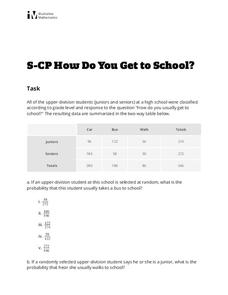
How Do You Get to School?
Looking for a short assessment on probability? Learners use a two-way table to calculate a probability and a conditional probability. Multiple choice answers could be eliminated to create a short-answer activity for your class. There are...
Curated OER
Slope & Rate of Change
This short handout addresses the concept of slope in two different ways: geometrically and analytically. Start with a brief description of slope, then use graphical representations to compare positive vs. negative slope and zero vs....
Illustrative Mathematics
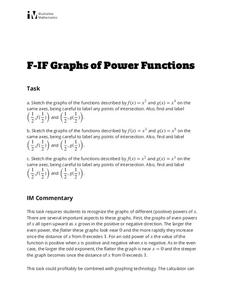
Graphs of Power Functions
This activity consists of three exercises in which learners sketch the graphs of various power functions on the same axes. They use their sketches to make comparisons and observations which lead to generalizations about the graphs of...
Curated OER
New Angle on Forest Ecology
Students measure and calculate the angle of the sun. They compare the leaf types on the north and south to compare the effects of the sun on the type of vegetation. They complete the activities inside the classroom or on a trip to a...


