US Department of Commerce
Applying Correlation Coefficients - Educational Attainment and Unemployment
Correlate education with unemployment rates. Individuals compare state and regional unemployment rates with education levels by calculating the correlation coefficient and analyzing scatter plots. Pupils begin by looking at regional data...
PBS
Soul Food Junkies: Portions
Serve up a rate of percents. The Math at the Core resource investigates the percent of daily value of sodium and saturated fats in different foods. Pupils determine the number of serving sizes they eat of popular snack foods and...
Illustrative Mathematics
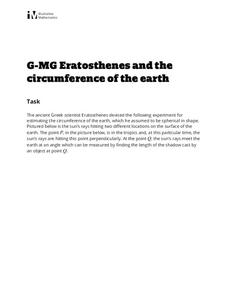
Eratosthenes and the Circumference of the Earth
The class gets to practice being a mathematician in ancient Greece, performing geometric application problems in the way of Eratosthenes. After following the steps of the great mathematicians, they then compare the (surprisingly...
EngageNY
Modeling with Polynomials—An Introduction (part 1)
Maximizing resources is essential to productivity. Class members complete an activity to show how math can help in the process. Using a piece of construction paper, learners construct a box with the maximum volume. Ultimately, they...
Achieve
BMI Calculations
Obesity is a worldwide concern. Using survey results, learners compare local BMI statistics to celebrity BMI statistics. Scholars create box plots of the data, make observations about the shape and spread of the data, and examine the...
Yummy Math
US Holiday Candy Sales
Candy is a big business! Calculate the amount of money consumers spent on major holidays—Easter, Halloween, Christmas, Hanukkah, and Valentine's Day—based on the total amount of candy sales from 2011 and the percentage of each holiday's...
Howard County Schools
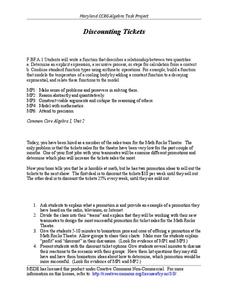
Discounting Tickets
A boss who can't do math? Oh, no! Young entrepreneurs use linear and exponential models to determine which discount will yield the most profit on ticket sales.
Mathematics Assessment Project
Funsize Cans
Designing fun-size cans ... what fun! Class members use the provided questions to determine the dimensions of a can with a minimum surface area for a given volume. The task allows learners to use graphs or algebraic manipulation to solve...
Federal Reserve Bank
Retirement Planning
It's never too early to start saving for retirement. In fact, the earlier one starts, the better! Use this retirement planning activity to teach the importance of a retirement strategy and why to start at a young age.
Curated OER
Calculating Probabilities: Introduction
Introduce your class to a sure-fire method for calculating probabilities. The method is described alongside several examples, then put into practice with a series of probability questions for the class to solve. This would be a great...
Curated OER
Using a Calculator
Students use a calculator to solve math problems. For this calculator usage lesson, students get into pairs and familiarize themselves with the keys. Students are then given problems to solve using the calculator. Students do Smart Board...
Curated OER
Calculating Your Foodometer
Students explore environmental issues by completing a food production class activity. In this carbon footprint lesson plan, students discuss the types of foods they eat, where they come from and what types of methods are used to...
Curated OER
Family Activity - Color by Numbers: Fractions, Decimals, and Percents
Learners solve four short answer problems. They determine the number of each color of candy or paper clip in a bag, and calculate the fractional, decimal, and percentage representation of the color compared to the total number of items.
Curated OER
Logic and Problem Solving: Math Hunt
In these math lesson plans, students discuss how math problems are written to reflect real-world situations. They complete an online Math Hunt using specific web tools, and work individually to create their own Math Hunts. Additionally,...
Curated OER
Interpret Clock Time
Save yourself a few minutes of planning with this elementary math lesson on elapsed time. Through a series of collaborative and independent learning activities, children explore different real-world situations as they learn how to...
Prince William Network
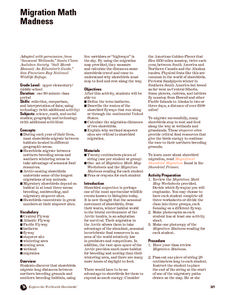
Migration Math Madness
A great way to incorporate math into life science, this lesson has learners measure migratory routes on a map and calculate the actual distance that shorebirds on the routes would cover. Learners compute the distance covered in both...
EngageNY
More on Modeling Relationships with a Line
How do you create a residual plot? Work as a class and in small groups through the activity in order to learn how to build a residual plot. The activity builds upon previous learning on calculating residuals and serves as a precursor to...
Curated OER
The Coordinate Plane
Use this Saxon math coordinate plane worksheet to have your learners utilize a graphing calculator, equate the vertices of a rectangle, and then graph their conclusions as well as answer a variety of fill in the blank equations.
Illustrative Mathematics
The Lighthouse Problem
Long considered the symbol of safe harbor and steadfast waiting, the lighthouse gets a mathematical treatment. The straightforward question of distance to the horizon is carefully presented, followed by a look into the different...
Teach Engineering
Start Networking!
Class members create their own social networks by collecting signatures before graphing the interactions with their fellow classmates. The degree distribution of the simulated social network is determined by calculating the degree of...
Teach Engineering
Density Column Lab - Part 1
Mass and density — aren't they the same thing? This activity has groups use balance beams and water displacement to measure several objects. The pupils use the measurements to calculate the density of the objects.
Mathematics Vision Project
Module 1: Getting Ready Module
This fabulous resource is a must-have for any algebra teacher's arsenal of lessons. Developing the idea of equations and use of variables from basic physical scenarios, learners gain valuable intuition in the structure and meaning of...
Statistics Education Web
When 95% Accurate Isn’t
Investigate the effect of false positives on probability calculation with an activity that asks scholars to collect simulated data generated by a calculator. To finish, participants analyze the probability of certain outcomes which lead...
Illustrative Mathematics
How Many Cells Are in the Human Body?
Investigating the large numbers of science is the task in a simple but deep activity. Given a one-sentence problem set-up and some basic assumptions, the class sets off on an open-ended investigation that really gives some context to all...


