Curated OER
The Same but Different Part II
Third graders experiment with beakers of water and balloons to measure the volume of the gas in the balloon. They determine ways to change the volume of air in the balloon which changes its size but not its physical state. By heating the...
Curated OER
Convection Currents
Students explain and understand the circulation of air in the atmosphere. They identify that energy can be carried from one place to another by heat flow or by waves, including water, light and sound waves, or by moving objects. ...
Curated OER
THE ROLE OF A CONTROL IN THE EXPERIMENTAL DESIGN
Students study the role of controls. They discuss variables and list conditions, that if not kept the same for both flasks, could effect the outcome of the experiment. They come up with most of the following: Amount and temperature of...
Curated OER
Winter Wonderland - Winter Olympics and the Water Cycle
After a concise introduction to the water cycle, junior meteorologists access NOAA's average snowfall data. They choose a city to examine in terms of precipitation. Then they look at historical snowfall data and use it to predict snow...
Curated OER
Volcanoes!: The Dangers of Snow and Ice
Students observe a demonstration of how melting snow and ice can contribute to mudflows. They then observea list of continents with the number of snow and ice covered mountains on each continent and discuss. They then label a group of...
Curated OER
Dissolved Oxygen and Respiration
Students are presented with the question, "Do plants that grow underwater use oxygen?" They create an experiment to test the presence of dissolved oxygen in the water using provided materials. Student experiments include a control jar as...
Curated OER
Tides in the Hudson
Students view an illustration of the Hudson River watershed and identify the bodies of water shown. They discuss what happens when fresh and salt water mix. Students view a teacher demonstration of the stratification of fresh and salt...
Curated OER
Change Since 1609
Students recognize how the climate of the Hudson Valley has changed since the last glaciation. They explain these changes using a reconstruction of the land use changes in the Hudson Valley composed of confetti, Ziploc bags and other...
Curated OER
Paleoclimate of the Hudson Valley
Students recognize how the climate of the Hudson Valley has changed since the last glaciation and be able to explain these changes. They reconstruct the paleoclimate of the Hudson Valley.
Centre for Innovation in Mathematics Teaching
Ratio and Proportion
Middle schoolers review the definition and rules for equivalent fractions. Additionally, they are introduced to equivalent ratios. They write examples of ratios from the board, and they come to the board to write the correct equivalent...
Wild BC
The Greenhouse Effect: Warming the Earth Experiment
First in a two-part lesson on the greenhouse effect, this lesson involves a classroom demonstration of the phenomenon, and a lab group experiment with color and absorption. Although there are easier ways to demonstrate the greenhouse...
Polar Trec
Who Will Melt First?
If the Greenland ice sheet melted, sea levels would rise by about 20 ft; if the Antarctic ice sheet melted, sea levels would rise by 200 ft. Scholars explore ice melting through the analysis of different ice samples, clean and dirty ice....
Curated OER
A Tour Down the Hudson River
Students discuss how the Hudson River is an ecosystem made up of both biotic and abiotic factors. They view the PowerPoint the Journal Down the Hudson River. Students become aware of where the Hudson River begins and ends, the plant and...
Curated OER
Is Our Water Healthy?
High schoolers test water for a least one chemical characteristic. They hypothesize how a storm event might change the chemical characteristics of a stream. Students collect water samples and use the chemical test to test the water.
Curated OER
Zebra Mussel Population Simulation
Students are taught how to format and enter data into an Excel spreadsheet. They make a graph, and interpret graphed data. Students discuss the possible impacts of zebra mussels on the Hudson river. They graph zebra mussel data.
Curated OER
Aquatic Ecosystem Exploration
Students visit a local stream, pond, creek, or river and collect macroinvertebrates. They sort macroinvertebrates and identify each species using a dichotomous key. Students decide on trophic levels and construct a possible food web for...
Curated OER
What If There's No Light?
students discuss the importance of light and the consequences of living without it. Using a plant as a demonstration, students predict and observe what happens to a plant when it does not receive enough light. In groups, they experiment...
Curated OER
Runoff: Intro to Watersheds
Learners are taught that a watershed is, what types of basic land cover are impermeable and permeable to water. They trace the flow of water around their school and around their home. Students determine what watershed their school is a...
Curated OER
Invasives and Marsh Birds
Students are taught that invasive plant removal can have a variety of impacts. They are shown this by using graphs. Students view maps of vegetation change on Iona Island. They discuss implications of changes on marsh birds using data...
Curated OER
Water Chestnut Graphing Activity
Students are taught how to format and enter data into an Excel spreadsheet. They make a graph and interpret graphed data. Students discuss possible impacts of water chestnut invasion. They graph data on water chestnut. Students report...
Curated OER
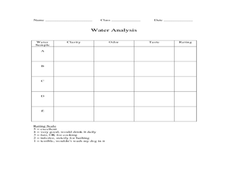
Water Quality with Samples
Students recognize whether one wants to drink water, swim in it, or for the health of the organisms living in it. They prepare different water samples to observe and collect samples regarding the water quality.
Curated OER
Bottled Water vs. Tap Water
Learners analyze the similarities and differences between tap water and bottled water. They make informed decisions about their use of each. Students are asked if they drink mostly tap water straight from the tap or water fountain. They...
Curated OER
Land Use Change Introduction
Students discuss the major changes that have taken place in the Hudson Valley over the past 400 years. They use aerial photos to describe major trends in Dutchess County. Students view a PowerPoint presentation. They work in small groups...
Curated OER
Hudson Valley Rocks
Students identify each of the rocks provided and locate where in the valley they are found. They explain why the rocks came to be as they are in each location. In addition, they relate the exercise to how the Hudson Valley's geologic...
Other popular searches
- Air Temperature and Wind
- Sunlight Air Temperature
- Air Temperature and Wind]
- Snow and Air Temperature
- Candle Air Temperature
- Air Temperature Pressure
- Temperature and Air Movement
- Air Temperature Air Pressure
- Oceans and Air Temperature
- Air Temperature Lesson Plan
- Atmosphere and Air Temperature


