Texas State Energy Conservation Office
Investigation: Blowing in the Wind
Using a simulated air sample, environmental or earth science pupils examine the components. You will need to prepare the faux air by using a hole punch and various colors of construction paper. Each color will represent a different...
Curated OER
Ecosystems and Remote Sensing
Students obtain remote sensing data to compare and contrast global biomass data with global temperature data.
Curated OER
Specific Heat of Air and Soil
Students are introduced to the concept of specific heat. In groups, they are given a set of data showing the temperatures of air and soil samples in which they calculate the ranges of the data. They identify whether the air or soil...
Curated OER
Diurnal Temperature Changes and Water Vapor Content
High schoolers examine the greenhouse effect, as they determine how moisture in the air affects the diurnal temperature range. Their investigation help them to explain different climatological regimes of both the Southern Great Plains...
Curated OER
Air Masses
Learners are given maps depicting two or more air masses and they then categorize bodies of air by temperature and moisture characteristics. They recognize large regions of similar type air. Students are given a map of air temperatures...
Curated OER
Turning the Air Upside Down
Students analyze how engineers study temperature inversions and convection currents to understand why pollution levels may be higher in some areas than others. They participate in an experiment that allows them to build simple models to...
Curated OER
Ocean Currents and Sea Surface Temperature
Students use satellite data to explore sea surface temperature. They explore the relationship between the rotation of the Earth, the path of ocean current and air pressure centers. After studying maps of sea surface temperature and ocean...
Curated OER
Air Pressure and Wind
In this air pressure and wind activity, students answer fifteen questions about how air pressure is measured, what it is, the reasons for changes in air pressure and the weather as air pressure changes. They also answer questions about...
Curated OER
Temperature and Thermal Energy
For this temperature worksheet, students answer 8 questions about temperature and thermal energy. For example, "What term refers to an energy transfer that causes a change in temperature?"
Curated OER
Air Pollution:What's the Solution?-Weather's Role
In this air pollution and weather worksheet, learners collect data using an online animation to determine the air quality at given times along with the wind speed and temperature in a particular city. Students make 3 bar graphs using the...
Curated OER
What happens When Air is Heated or Cooled?
In this pressure worksheet, students write down their observations of a can placed into hot water. They explain what happens to the air molecules and the pressure inside the bottle which causes it to collapse.
Center for Innovation
Air Pollution: What is the Solution?
For this air pollution worksheet, students use an online simulation called "Smog City" to manipulate different conditions that affect air pollution. Students answer questions about the health effects at peak ozone levels for different...
Curated OER
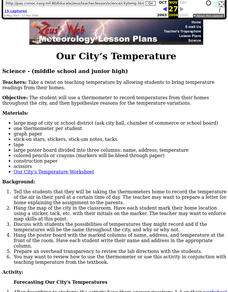
Our City's Temperature
Students use a thermometer to record temperatures from their homes throughout the city, and then hypothesize reasons for the temperature variations. They use a weather graph worksheet that's imbedded in this lesson to orgainize their data.
Curated OER
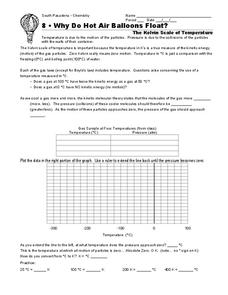
Why Do Hot Air Balloons Float?
In this gases worksheet, students read about the Kelvin scale of temperature, they answer 3 fill in the blank questions about the relationship between temperature and pressure and they plot the temperature and pressure of gas samples at...
Center for Innovation
Air Pollution: What's the Solution?
In this air pollution worksheet, learners collect data for their county of residence as well as 10 surrounding counties including the total population and the county grade for the air. They use a map of their state and identify the 10...
Curated OER
The Air Up There
In this data collection and analysis activity, learners observe and graph the weather conditions during one school week, then calculate the average weather temperature. Extensions are included.
Curated OER
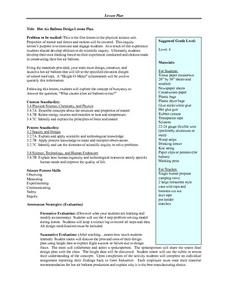
Hot Air Balloon Design Lesson Plan
Sixth graders discuss what they know and what they want to know about hot air balloon using a KWL chart. They then use a wide array of materials to design a hot air balloon that will lift successfully in cooperative groups referring to...
Curated OER
Using Vegetation, Precipitation, and Surface Temperature to Study Climate Zones
Middle schoolers begin their examination of the climate zones found around the world. Using a software program, they identify the relationship between the vegetation, climate and temperatures of the different zones. They also plot...
Baylor College
Moving Air
In lab groups, young scientists place aluminum cans with a bubble-solution cap into different temperatures of water to see what size of bubble dome forms. As part of an atmosphere unit in preparation for learning about convection...
Curated OER
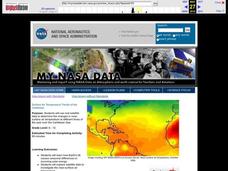
Surface Air Temperature Trends of the Caribbean
Students investigate the seasonal changes to sea surface and near-surface air temperatures near the equator. They use actual satellite data to track and graph the differences in air and sea temperatures during different seasons in the...
Curated OER
Tracking the Weather
Learners study the weather over time in this lesson. In this weather lesson, students record weather information from the newspaper over a month's time. They record the wind speed and direction, the barometric pressure, the air...
Curated OER
Temperature Changes Everything
Middle school chemists visit interactive websites in order to discover what happens to molecular motion when heat is added to matter. They conduct an experiment that demonstrates the expansion of matter with the addition of heat. A lab...
Curated OER
Measuring Temperatures
Fourth graders participate in a teacher-led discussion about temperature--hot and cold. Each group of students is assigned specific materials for their lab experiment. They record temperatures measured in their journals and then plot...
Polar Trec
Temperature Profile above the South Pole
Collecting and understanding data is a big part of understanding the world and how it changes. To better grasp what temperatures are changing and how they affect global populations, learners create a graph based on the date provided....
Other popular searches
- Air Temperature and Wind
- Sunlight Air Temperature
- Air Temperature and Wind]
- Snow and Air Temperature
- Candle Air Temperature
- Air Temperature Pressure
- Temperature and Air Movement
- Air Temperature Air Pressure
- Oceans and Air Temperature
- Air Temperature Lesson Plan
- Atmosphere and Air Temperature


