Curated OER
Prime Numbers
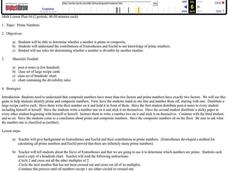
Students differentiate between prime and composite numbers. In this algebra instructional activity, students define the terminology and investigate the contributions made by Eratosthenes and Euclid as it relates to prime numbers....
Curated OER
Interest and Credit
Young scholars define interest and credit. In this algebra lesson, students analyze the pros and cons of having credit versus debit and interest as it applies to credit and debit. Young scholars apply the ideas of interest and credit in...
Curated OER
Natural Inspiration
Students relate math to the real world. In this algebra lesson, students compare plants to math and relate their artistic ability to concepts in math. They draw pictures of flowers, leaves and trees.
Curated OER
Building Scales and Ratios
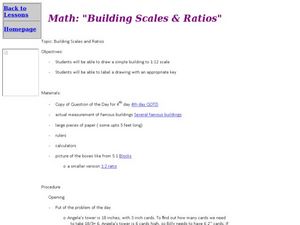
Young scholars solve problems using scales and ratios. In this algebra lesson, students create drawings using scales of 1:12. They follow a key to help them draw different buildings using the right scales. They also complete word...
Curated OER
Complex Fractions
In this algebra worksheet, students divide complex fractions using properties of division and reciprocals. They are to get rid of all negative exponents. There are 48 problems.
Curated OER
First Rhythmic Composition
Students apply fractions to counting rhythm in music. In this algebra activity, students interrelate the concept of math into music as they fill out a chart identifying the names and symbols of music notes and their equivalent values in...
Curated OER
Tic-Tac-Toe
Students investigate finite mathematics using a flow chart. In this algebra lesson, students investigate logic and strategies using flowcharts. Students compete against each other using different approaches to playing the game.
Curated OER
Pumped Up Gas Prices
Students calculate gas prices. In this transportation lesson, students tally the mileage and gas costs of their car for one months. They figure out how much was spent on gas and create a graph showing average gas prices over time.
Curated OER
How Many Blades of Grass in a Football Field?
Students, by taking a sample count from a small area, estimate the total number of blades of grass in a football field. They use a cardboard from, the inside of which measures 1 square foot to do their calculations.
Curated OER
The Great Grid
Students explore the coordinate plane. In this middle school/Algebra I instructional activity, students use dice with numbers and signs to play a game in which they must locate points on a coordinate plane. Students work in teams to...
Curated OER
Data Analysis and Probability
Students make their own puzzle grid that illustrates the number of sit-ups students in a gym class did in one minute, then they make a histogram for this same data. Then they title their graph and label the scales and axes and graph the...
Curated OER
Rectilinear Motion
Twelfth graders rewrite word problems using algebraic expressions. In this calculus lesson plan, 12th graders calculate the velocity, time and acceleration while analyzing real life scenarios. They solve problems related to when the...
Curated OER
In Strawberry Fields
Students discuss the origin of strawberries and employees involved with picking strawberries. In this algebra instructional activity, students discuss how much a worker who picks strawberry makes based on their flats. They create a table...
Curated OER
Solving Equations as Word Problems
Students solve linear equations using word problems. In this algebra lesson, students rewrite the word problems by identifying the important information. They make a table and graph their results to analyze it.
Curated OER
Writing Equations from a Story
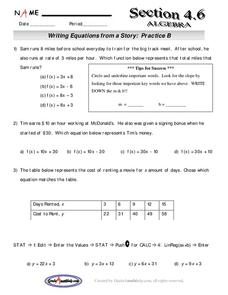
Students write an equation from a story problem. In this algebra lesson, students solve liner equations they have created from a word problem. They read the problem and identify important words as they solve the equation.
Curated OER
Lines of Fit
Students analyze graphs. In this algebra lesson, students find the line of best fit, using scatter plots. They calculate the sale of popcorn as it relates to the price. They then analyze the graphs for positive, negative and no correlation.
Other popular searches
- Algebra 1 Powerpoint
- Algebra 1 Venn Diagrams
- Algebra 1 Game
- Algebra 1 Signed Numbers
- Algebra 1 Graphing
- Algebra 1 Lesson Plans
- Algebra 1 Weighted Averages
- Algebra 1 Notes
- Math Algebra 1
- History of Algebra 1
- Algebra 1 Powerpoint Review
- Algebra 1 Lessons


