Curated OER
Graphing Solutions
In this graphing solutions worksheet, 9th graders solve 13 various types of problems. First, they find the solution of each systems by graphing on the coordinate plane provided. Then, students solve each systems of equations...
Curated OER
Transformations of Functions 1
Learn how to solve problems with transformation. Students perform transformation on their graphs. Then, they use the TI to create a visual of the graph as it is moving along the graph.
Curated OER
Exploring Power Functions 1
Learners describe the end behavior of polynomial functions. Pupils relate the behavior of the graph to the exponent of the graph. They differentiate graphs with odd-exponent and graphs with even exponents.
Curated OER
Regents High School Examination Integrated Algebra
In this integrated algebra worksheet, students complete 39 multiple choice problems. This is a copy of the 2009 State of New York exam.
Curated OER
Coloring Interval Graphs
Students investigate planning an activity and getting it done on time. In this algebra instructional activity, students define vocabulary words related quadratic equations, including the vertex and intervals. They figure a good way to...
Curated OER
Using Excel To Teach Probability And Graphing
Learners engage in the use of technology to investigate the mathematical concepts of probability and graphing. They use the skills of predicting an outcome to come up with reasonable possibilities. Students also practice using a...
Curated OER
Solving Systems by Graphing
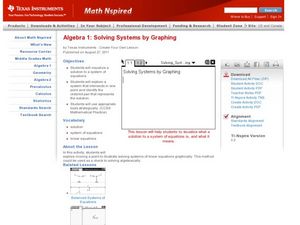
Solve systems of equations with your super smart upper graders. They solve systems of equations and then graph two lines to find where they intersect. The focus on the activity is to have learners explore moving a point to illustrate...
Curated OER
Graphs
Students explore graphs and define the different ways they are used to display data. In this algebra lesson, students collect data and plot their data using the correct graph. They draw conclusions from their graphs based on their data.
Curated OER
Bar Graphs
Students perform operations and graph their data using charts and bar graphs. In this algebra lesson, students follow specific steps to make a bar graph. They create a survey about people favorite things and plot their data from the...
Curated OER
Bar Graphs and Pie Charts
Students graph data they collected and analyze it using a bar graph. In this algebra lesson, students analyze their data using pie charts and bar graphs while explaining the meaning to each other. They compare and contrast bar graphs vs...
Curated OER
Forces and Graphing
Young scholars analyze graphs to determine relationships between variables and rates of change. They determine the basic concepts about static reaction forces. They determine the slope and equation of a line.
Curated OER
Monopoly Graphs
Students relate the concepts of linear functions to the game of monopoly. In this algebra lesson, students solve problems with ratio and proportion. They collect data and graph it.
Curated OER
Model and Solve Algebraic Equations
Examine multiple ways to solve algebraic equations. Pupils will generate a problem solving strategy that addresses the prompt given by the teacher. They will then share their problem solving strategy with the class. Graphic organizers,...
Curated OER
One to One Functions
In this algebra worksheet, students identify one to one functions by analyzing graphs of different equations. There are 6 different types of graphs to be analyzed.
Curated OER
Using Parallel Axes To Discover Mathematical Interconnections
In this math worksheet, students graph the functions on parallel axes and observe the location of the slope point in relation to the x and y axes.
Curated OER
College Prep Worksheet Chapter 2, 2.1-2.4, 2.6, 2.8 & 7.5
For this algebra worksheet, students identify the coefficient, simplify expressions, solve algebraic equations, and graph inequalities. This worksheet contains 93 equations, with an answer key.
National Security Agency
Multiple Representations of Limits
After an introductory activity to demonstrate the theory of a limit, additional activities approach a limit from graphical, numerical, and algebraic methods. The activity looks at the multiple ways of understanding and evaluating a limit.
Howard County Schools
Drawing Inverses
An Algebra II instructional activity draws the connection between the exponential function and its inverse. By graphing an exponential function and using tables and a calculator, learners graph the logarithmic function. The plan comes...
EngageNY
Are All Parabolas Similar?
Congruence and similarity apply to functions as well as polygons. Learners examine the effects of transformations on the shape of parabolas. They determine the transformation(s) that produce similar and congruent functions.
EngageNY
Solving Inequalities
Do properties of equations hold true for inequalities? Teach solving inequalities through the theme of properties. Your class discovers that the multiplication property of equality doesn't hold true for inequalities when multiplying by a...
EngageNY
Tides, Sound Waves, and Stock Markets
Help pupils see the world through the eyes of a mathematician. As they examine tide patterns, sound waves, and stock market patterns using trigonometric functions, learners create scatter plots and write best-fit functions.
Illustrative Mathematics
The Circle and The Line
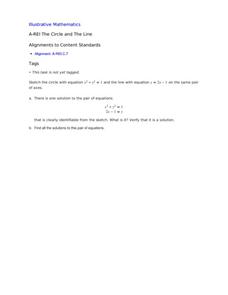
Here is a resource where algebra learners show their understanding of a system of equations involving a circle and a line. Once graphed, learners see two points of intersection, one where the ordered pair is read, and a second where...
EngageNY
Why Call It Tangent?
Discover the relationship between tangent lines and the tangent function. Class members develop the idea of the tangent function using the unit circle. They create tables of values and explore the domain, range, and end behavior of the...
Shodor Education Foundation
InteGreat
Hands-on investigation of Riemann sums becomes possible without intensive arithmetic gymnastics with this interactive lesson plan. Learners manipulate online graphing tools to develop and test theories about right, left, and midpoint...


