SHS Algebra
Linear vs. Exponential Functions Tasks
Your algebra learners will enjoy the real-life application of the three tasks presented here. They complete a table and a graph comparing the two options presented. One option is linear, while the other is exponential. After coming up...
West Contra Costa Unified School District
Comparing Linear and Quadratic Functions
If a linear function and a quadratic function enter a boxing match, which one would win? Learners first review how to find key features of linear and quadratic functions. Next, they compare key features of pairs of functions.
Curated OER
Writing Linear Equations in Different Forms
This activity is jam-packed with linear equations! Learners write equations in slope-intercept form and standard form. Horizontal and vertical lines are included, as well as graphs for several of the problems. A great way to...
EngageNY
Building Logarithmic Tables
Thank goodness we have calculators to compute logarithms. Pupils use calculators to create logarithmic tables to estimate values and use these tables to discover patterns (properties). The second half of the lesson has scholars use given...
Virginia Department of Education
How Much is that Tune?
Tune in for savings! Scholars investigate pricing schemes for two different online music download sites. After comparing the two, they determine the numbers of songs for which each site would be cheaper.
Curated OER
Line of Best Fit
In this line of best fit activity, students solve and complete 8 different problems that include plotting and creating their own lines of best fit on a graph. First, they study the samples at the top and plot the ordered pairs given on...
Kuta Software
Points in the Coordinate Plane
Keep young mathematicians on point with this coordinate plane worksheet. From plotting ordered pairs to identifying the quadrant and coordinates of specific points, this resource covers all the basic skills students need to have...
Curated OER
Solving Quadratic Equations
In this Algebra I/Algebra II learning exercise, students solve quadratic equations by graphing and by taking the square root of both sides. The two page learning exercise contains a combination five multiple choice and free...
Curated OER
Review of Linear Equations
In this algebra learning exercise, students solve linear equations and rewrite them in the form y=mx + b. They graph the equations using the slope and y-intercept. There are 22 questions with an answer key.
Curated OER
Data collection and analysis
In this probability and statistics worksheet, high schoolers determine when a survey or collected data could be biased. The one page worksheet contains a combination of three multiple choice and free response questions. ...
Curated OER
Quadratic Inequalities
In this quadratic inequalities worksheet, students graph six quadratic inequalities. They solve two quadratic inequalities to identify one solution. In this quadratic inequalities worksheet, students draw the parabola and shade inside or...
Curated OER
Absolute Value Inequalities
In this absolute value inequalities instructional activity, students solve given inequalities and graph their solution. This four-page instructional activity contains 26 problems. Answers are provided on the last two...
Curated OER
Systems of Inequalities
In this algebra worksheet, learners solve systems of inequalities by graphing and shading the shared solution. There are 14 questions with an answer key.
Curated OER
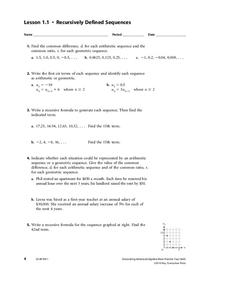
Recursively Defined Sequesnces
In this algebra worksheet, students solve a pattern or sequence using geometric and arithmetic formulas. There are 21 questions on 5 different sections.
Curated OER
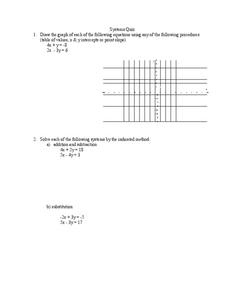
Systems of Equations
In this algebra worksheet, students solve systems of equation through graphing, linear combination and substitution. There are 3 questions.
Curated OER
Worksheet 2.4 Introduction to Inequalities
For this math worksheet, students read the examples that focus upon the concept of inequalities. The examples include the graph of the line.
Curated OER
Functions Quiz
In this college level algebra worksheet, pupils determine the domain and range of a function, determine the average rate of change given an interval and the function, and graph a polynomial function. The two-page worksheet contains four...
Curated OER
Chapter 2 Practice Test
In this algebra learning exercise, learners examine and graph linear equation, inequalities, and absolute value inequalities in two variables. The three page learning exercise contains forty-six problems. Answers are not...
Curated OER
Points of Intersection
Eighth and ninth graders solve five different problems that include solving two equations. They determine the point of intersection in each of the five pairs of equations given. Pupils define point of intersection as the point where two...
Curated OER
Inequality Shading Investigation
In this inequality instructional activity, students graph the inequality of a line. They list ten integer coordinates that lie on the grid. Students explore their findings and answer thought questions. They shade the graph to indicate...
Curated OER
Linear Inequalities in Two Variables
Use this worksheet as a warm up, a refresher exercise, or a practice after a more detailed lesson on graphing linear inequalities in two variables. Start with boundaries that are horizontal or vertical, then move into graphs with...
Curated OER
Exploration 1: Instantaneous Rate of Change Function
In this function worksheet, students read word problems and write functions. They determine the instantaneous rate of change and identify intervals. This three-page worksheet contains approximately 20 problems.
Curated OER
Simultaneous Equations for Circuit Analysis
In this worksheet, students use Algebra to plot different solutions to equations and analyze schematics in order to answer a series of 25 open-ended questions about electrical circuits. This worksheet is printable and the answers are...
Curated OER
Scatterplots and Regressions
For this scatterplots and regressions worksheet, students solve 6 different types of problems related to graphing scatterplots and interpreting regressions. First, they create a scatterplot from the given data coordinates and then,...


