Curated OER
Worksheet 6, Graphing Functions
In this algebra worksheet young scholars graph a given function by completing the square. They analyze a function and tell the axis of symmetry, the intercepts, and vertex. Students identify the maximum or minimum of a graph. Young...
Institute of Electrical and Electronics Engineers
Rotational Equilibrium
Physics stars design mobiles that demonstrate rotational equilibrium. They take measurements and solve related equations for force by graphing, substitution, or determinants. This is a well-developed lesson plan, complete with student...
Curated OER
Rainbows, Bridges & Weather, Oh My!
Explore how real-world applications can be parabolic in nature and how to find quadratic functions that best fit data. A number of different examples of modeling parabolas are explored including a student scavenger hunt, the exploration...
Illustrative Mathematics
Delivering the Mail
A mail truck travels the same amount of miles per day. It will be up to your algebra learners to find an equation for this mailman’s truck. One needs a good understanding of rate of change and the initial value for this model. The...
Curated OER
Graph Dynamic Linear Equations
Students explore the concept of linear equations. In this linear equation lesson, students change parameters of an equation and notice the effect it has on its graph.
Curated OER
Integrated Algebra: State Exam
In this integrated algebra worksheet, students solve problems related to topics covered in algebra for the entire year. Topics include, but are not limited to, inequalities, probability, functions, interval notation, exploring graphs,...
Curated OER
Algebra: Sorting, Representing, and Patterns
Students sort objects and create patterns. In this sorting and graphing lesson, students work at centers to find a way to sort a group of objects, then make a graphical representation of the number of each item. Finally, students create...
Curated OER
Graphing and the Coordinate Plane
Students gain practice reading coordinates and plotting points by participating in the Coordinates! Game. They demonstrate and test their skills with graph paper and the Maze Game.
Curated OER
Algebra II: Exponential Functions
Students investigate, describe, and predict the effects of parameter changes on the graphs of exponential functions; describe limitations on the domains and ranges of these functions; and examine asymptotic behavior.
Curated OER
Graphing Linear Equations on the TI
Pupils graph linear equations on the TI calculator. In this algebra lesson, students rewrite equations in the slope intercept form and use the calculator to graph their problem. They work together to interpret the graphs off of the TI.
Curated OER
Graphing Ordered Pairs
Seventh graders investigate the concept of ordered pairs as found in Algebra. They are introduced to the data set that corresponds to the coordinate system. Also students practice the graphing the ordered pairs using the x and y axis.
Curated OER
Graphing Linear Equations
Students graph linear equations. For this algebra lesson, students investigate the price of tolls in different states and create a graph. They analyze their graph and draw conclusions.
Curated OER
Graphing System of Equations
Students solve system of equation. In this algebra lesson, students graph, substitute and eliminate to solve system of equation. They identify the point of intersection and how many solution each system will have.
Curated OER
Graphing Linear Equations
Young scholars graph linear equations. For this algebra lesson, students solve linear equations and graph it on a coordinate plane. They evaluate integers using linear equations.
Curated OER
Mathematics Within: Algebraic Processes and Its Connections to Geometry
Fifth graders discover the connections between algebra and geometry. With a focus on arrays and factors, they are introduced to multiplication. They develop an array for multiples of 2 through 10 and identify the factors of each row....
Curated OER
Rational Function Graphs
Students use algebraic methods to represent and solve problems. Using a graphing calculator, students solve rational and inequality problems. They visually demonstrate solutions of functions through graphing. Students answer questions...
Curated OER
Statistical Analysis For Graphing Calculators
Young scholars analyze date from the Chesapeake Bay. Using a graphing calculator, they enter the data, plot three temperatures, and create a Box and Whisker plot.
EngageNY
Transformations of the Quadratic Parent Function
Efficiently graph a quadratic function using transformations! Pupils graph quadratic equations by completing the square to determine the transformations. They locate the vertex and determine more points from a stretch or shrink and...
Kenan Fellows
Dinner Party: Using Pattern Trains to Demonstrate Linear Functions
Nothing fancy here ... just your run-of-the-mill Algebra party! Learners explore the patterns of linear functions while designing seating arrangements for a dinner party. Comparing the number of tables to the perimeter of the combined...
EngageNY
Ferris Wheels—Tracking the Height of a Passenger Car
Watch your pupils go round and round as they explore periodic behavior. Learners graph the height of a Ferris wheel over time. They repeat the process with Ferris wheels of different diameters.
EngageNY
Modeling a Context from a Verbal Description (part 2)
I got a different answer, are they both correct? While working through modeling problems interpreting graphs, the question of precision is brought into the discussion. Problems are presented in which a precise answer is needed and others...
EngageNY
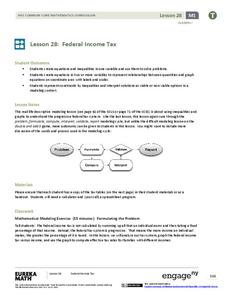
Federal Income Tax
Introduce your class to the federal tax system through an algebraic lens. This resource asks pupils to examine the variable structure of the tax system based on income. Young accountants use equations, expressions, and inequalities to...
West Contra Costa Unified School District
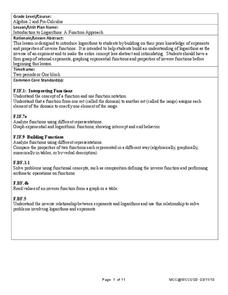
Introduction to Logarithms
Build on pupils' understanding of inverse functions by connecting logarithmic functions to exponential functions. This activity allows individuals to see graphically the inverse relationship between an exponential and logarithmic...
EngageNY
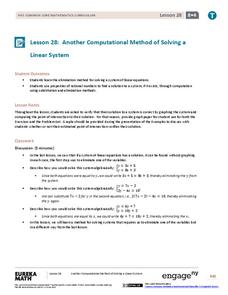
Another Computational Model of Solving a Linear System
The process of elimination really works! Use elimination when substitution isn't doing the job. The 29th segment in a series of 33 introduces the elimination method to solving linear systems. Pupils work several exercises to grasp the...


