Houghton Mifflin Harcourt
Intensive Math
Three chapters worth of integer, fraction, and decimal problems to give you every type of question your learners need to be a successful mathematician. Thankfully the work has been done for you and this is a huge resource full of...
EngageNY
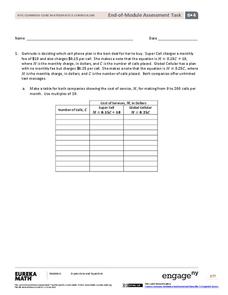
End-of-Module Assessment Task: Grade 6 Math Module 4
Finish out the module with a bang. The last installment of a 36-part module is an end-of-module assessment task. Test takers set up equations to represent relationships and solve problems in an assortment of contexts.
EngageNY
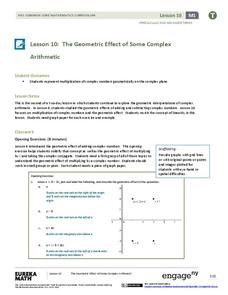
The Geometric Effect of Some Complex Arithmetic 2
The 10th lesson in a series of 32, continues with the geometry of arithmetic of complex numbers focusing on multiplication. Class members find the effects of multiplying a complex number by a real number, an imaginary number, and another...
EngageNY
Tax, Commissions, Fees, and Other Real-World Percent Problems
Pupils work several real-world problems that use percents in the 11th portion of a 20-part series. The problems contain percents involved with taxes, commissions, discounts, tips, fees, and interest. Scholars use the equations formed for...
Teach Engineering
Edible Rovers (High School)
Design and build a rover ... then eat it? This activity has groups of two design and build Mars rovers. The teams determine what instruments they want to include with their rover and plan a budget. They calculate the cost of the body of...
Los Angeles County Office of Education
Assessment For The California Mathematics Standards Grade 6
Test your scholars' knowledge of a multitude of concepts with an assessment aligned to the California math standards. Using the exam, class members show what they know about the four operations, positive and negative numbers, statistics...
Willow Tree
Line Plots
You can't see patterns in a jumble of numbers ... so organize them! Learners take a set of data and use a line plot to organize the numbers. From the line plot, they find minimum, maximum, mean, and make other conclusions about the data.
EngageNY
Mid-Module Assessment Task: Grade 7 Mathematics Module 4
Assess the ability of the class to solve percent problems with an assessment that covers a variety of percent problems from basic to multi-step. Pupils make connections between percent problems and proportional thinking to complete the...
EngageNY
Mid-Module Assessment Task: Grade 7 Mathematics Module 3
Lesson 16 in the series of 28 is a mid-module assessment. Learners simplify expressions, write and solve equations, and write and solve inequalities. Most questions begin as word problems adding a critical thinking component to the...
Curated OER
Unit 0 Review - Measurement Lab Equipment
Review questions like these can be used in your biology, chemistry, physics, or earth science classes! They assess scientists' understanding of laboratory measurement tools including graduated cylinders, thermometers, and balances. They...
Curated OER
Worksheet 14 - Rates
For this rate worksheet, students draw and label given situations, determine the rates and the relationship between them. This two-page worksheet contains 7 multi-step problems.
Curated OER
Systems of Inequalities
For this Algebra I/Algebra II worksheet, learners determine the solution to a system of inequalities by graphing. The two page worksheet contains explanation, instruction, and four worked problems.
Curated OER
Systems of Linear Inequalities
In this Algebra I/Algebra II learning exercise, students use graphing to solve systems of linear inequalities. The two page learning exercise contains a combination of five multiple choice and free response questions. Answers are...
Curated OER
Relations and Functions
In this Algebra I/Algebra II worksheet, students determine if a relation is a function or not and find the functional value of a domain element. The two page worksheet contains a combination of nine multiple choice and free response...
Center of Excellence for Science and Mathematics Education
A Sick Astronaut
Aspiring astronauts graph, interpret, and analyze data. They investigate the relationship between two variables in a problem situation. Using both graphic and symbolic representations they will grasp the concept of line of best fit to...
Curated OER
Systems of Linear Inequalities
In this systems of linear inequalities worksheet, 9th graders solve and complete 10 various types of problems. First, they determine whether a given point is in the solution set of a system of linear inequalities. Then, students graph...
Curated OER
Quadratics and Parabola
In this algebra worksheet, 11th graders graph parabolas using the vertex and axis of symmetry. They apply parabolas to word problems as it applies to paths taken. There are 4 problems with an answer key.
Curated OER
Solving a System of Linear and Quadratic Equations
In this Algebra II worksheet, 11th graders use graphing to solve a system of equations in which one equation is linear and the other is quadratic. The three page worksheet contains a combination of nine multiple choice and free response...
Curated OER
Writing Linear Equations
For this Algebra I/Algebra II worksheet, students examine linear equations to determine the slope and y-intercept and write the equation of the line given the pertinent information. The one page worksheet contains a combination of seven...
Curated OER
Applying Linear Functions
In this algebra worksheet, learners rewrite word problems using algebra and relate linear functions to real life scenarios. There are 2 questions with an answer key.
Curated OER
Border Patrol ID: 11603
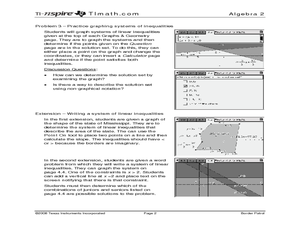
Incorporate technology in your classroom by teaching your students how to graph systems of linear inequalities as they apply to an area of land. The lesson provides an extension in which students are challenged to write a system of...
Curated OER
Quartiles, Percentiles, and Cumulative Frequency
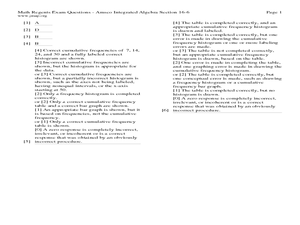
In this statistics lesson, 11th graders are asked to calculate the percentiles, quartiles and cumulative frequency given different graphs and data. There are 6 questions with an answer key.
Curated OER
Solving Inequalities
In this algebra worksheet, students solve inequality equations and graph them on the number line. There are 22 questions with an answer key.
Curated OER
Exploring Real Numbers
In this algebra activity, 11th graders classify numbers as rational, irrational, integral and whole. They solve the equations and graph i ton a number line. There are 26 questions with an answer key.


