Noyce Foundation
Ducklings
The class gets their mean and median all in a row with an assessment task that uses a population of ducklings to work with data displays and measures of central tendency. Pupils create a frequency chart and calculate the mean and median....
Virginia Department of Education
Curve of Best Fit
Which function models the data best? Pupils work through several activities to model data with a variety of functions. Individuals begin by reviewing the shapes of the functions and finding functions that will fit plotted data points. By...
Noyce Foundation
Gym
Give the class a mental work out with an assessment task in which young mathematicians compare several gym membership options. They use substitution to calculate the cost for given numbers of months.
Curated OER
Linear Inequalities
In this algebra worksheet, students solve linear inequalities. They graph their solution on a coordinate plane. There are 6 questions with answer key.
Curated OER
Linear Equations
In this algebra worksheet, students solve and graph linear equations. They differentiate between parallel and perpendicular lines. There are 35 questions about graphing.
Curated OER
Slope Y-intercept Quiz
In this algebra worksheet, students identify the slopes and y intercept of a line. They complete the quiz,by graphing and identify linear equations. There are 6 questions with an answer key.
Curated OER
The Distance Formula
For this distance formula worksheet, students solve and complete 28 various types of problems. First, they find the distance between each pair of points provided. Then, students solve and graph the points.
Curated OER
Organizing Data
In this statistics activity, 11th graders collect data and organize it using a frequency table. They plot their data and analyze it using stem and leaf plots. There are 3 questions with an answer key.
Curated OER
High School Mathematics Problems from Alaska:Cutting Cordwood
Students solve problems and answer questions about two young men attemtping to earn money by cutting cords of wood.
Curated OER
EOC Review G
In this end of course review, students factor expressions, interpret statistic problems, and identify the maximum and minimum of equations. This two-page worksheet contains 5 multi-step problems.
Curated OER
Hyperbola
In this Algebra II worksheet, students determine the vertices and foci of a hyperbola, write the equations in standard form, find the asymptotes, and sketch the graphs of hyperbolas. The one page worksheet contains thirty-one problems. ...
Curated OER
Using Inequalities to Problem Solve
Students explore inequalities. For this Algebra I lesson, students solve and graph linear inequalities involving addition, subtraction, multiplication, or division. Students use inequalities to solve and graph real-world problems.
Curated OER
Polynomial Functions
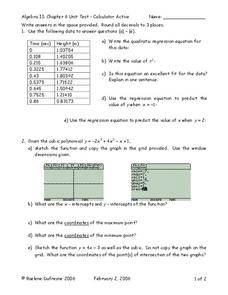
In this Algebra II activity, 11th graders use a graphing calculator to determine the regression equation of the given data, graph polynomial functions, factor polynomials, and determine the quotient and remainder in polynomial division....
Curated OER
Connections Involving Linear And Quadratic Functions
In this math worksheet, students determine the range of the function. Then they graph the functions while finding the coordinates on the plane.
Curated OER
Two Variable Inequalities
In this algebra worksheet, students solve inequalities using addition, subtractions and multiplication. They graph the inequalities with shading. There are 2 questions.
Curated OER
Quartiles and Box-and-Whisker Plots
In this algebra worksheet, learners identify the central tendencies as they solve a box and whisker plot graph. They identify the quartiles of the data. There are 4 questions with an answer key.
Curated OER
Systems of Two Equations
In this systems of equations worksheet, learners solve and complete 23 various types of problems. First, they solve each system of equations by graphing on the grids provided. Then, students solve each system by substitution and by...
Curated OER
Transformations Using Matrices
In this transformations learning exercise, 10th graders solve and complete 16 different types of problems. First, they graph the image of the figure using the transformation given. Then, students find the coordinates of the vertices of...
Curated OER
Matrices
In this Algebra II instructional activity, 11th graders solve problems that involve matrix representation, matrix operations, solving systems with inverse matrices, row reduction, and systems of inequalities. The six page instructional...
Curated OER
Polynomials Degree and Finite Differences
In this algebra worksheet, students identify polynomials and state the degree and rewrite it in standard form. There are 32 questions ranging from polynomials to graphing a quadratic.
Curated OER
Writing a Function Rule
In this Algebra I/Algebra II worksheet, students determine the equation that correctly represents the relationship between the x and y values provided. The one page worksheet contains four multiple choice problems. Answers are not...
Curated OER
Function Families
In this function families worksheet, students graph 6 families of absolute value equations on a graphing calculator and transfer a sketch to graph paper. Students then answer 8 questions to identify the vertex.
Curated OER
Worksheet 9, Rational Functions
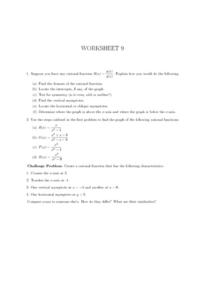
In this algebra worksheet, students tell how they would find the domain of a rational function. They find the intercepts of a rational function and graph it. Students test for symmetry, locate the asymptotes and determine where the graph...
Curated OER
Compound Inequalities
In this compound inequalities worksheet, students solve and complete 20 different types of problems. First, they solve each compound inequality. Then, students graph the solution for each inequality on the number line provided,


