EngageNY
Analyzing a Verbal Description
What function will describe the insect population growth? Pairs or small groups work together to determine which type of function and specific function will model given scenarios. The scenarios differentiate between linear,...
EngageNY
Analyzing a Data Set
Through discussions and journaling, classmates determine methods to associate types of functions with data presented in a table. Small groups then work with examples and exercises to refine their methods and find functions that work...
EngageNY
The “WhatPower” Function
The Function That Shall Not Be Named? The eighth installment of a 35-part module uses a WhatPower function to introduce scholars to the concept of a logarithmic function without actually naming the function. Once pupils are...
EngageNY
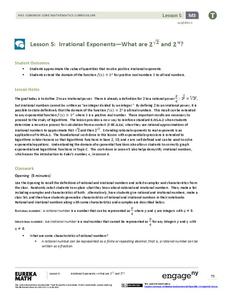
Irrational Exponents—What are 2^√2 and 2^π?
Extend the concept of exponents to irrational numbers. In the fifth installment of a 35-part module, individuals use calculators and rational exponents to estimate the values of 2^(sqrt(2)) and 2^(pi). The final goal is to show that the...
Virginia Department of Education
Logarithmic Modeling
Explore logarithms and logarithmic regression. Young mathematicians first learn about inverse functions and about the logarithm function family. They take their newfound knowledge to use logarithmic functions to model situations and...
Curated OER
Adding and Subtracting Integers: The Symbols + and -
This worksheet begins with an explanation of how to add and subtract positive and negative integers. Learners solve and complete 20 different problems that include these types of problems. First, they fill in each blank with the correct...
Curated OER
Geometry: Parallel and Perpendicular Lines
This basic handout would be good for skills practice or a review of parallel and perpendicular lines. Review the definitions, then practice writing equations of lines that pass through a specific point and are either parallel or...
Curated OER
Mean, Median, Mode, and Range: Practice
In this line plots instructional activity, students make a line plot for each set of data and identify any clusters or gaps. Students then find the mean, median, mode, and range for the first four problems. Students then find n using the...
Curated OER
Math 32 Worksheet: Quadratic Equations
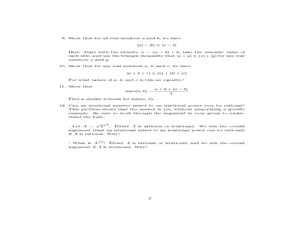
In this quadratic equations worksheet, high schoolers solve 12 short-answer problems. Students find real and irrational solutions to given functions. High schoolers raise irrational numbers to irrational powers.
Curated OER
Math A Regents Questions: Points on a Line
In this linear equations worksheet, students solve 3 multiple choice problems. Students determine if a given point lies on a line given an equation of that line.
Curated OER
Interval Notation and Linear Inequalities
In this interval notation and linear inequalities worksheet, students use number lines and solve equations. Students complete 64 problems total.
Curated OER
Solving Equations
In this solving equations instructional activity, 9th graders solve 24 different problems. First, they find the zeros of each function. Then, students solve each equation by factoring. They also solve each equation by completing the...
Curated OER
Quadratic Equations
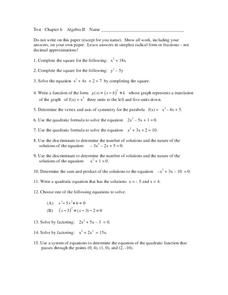
In this quadratic equations worksheet, students answer 15 questions about quadratic equations. Students complete the square, use the quadratic formula, write equations in vertex form, and solve quadratic equations by factoring.
Curated OER
Penny Toss - Exponential Growth and Decay
In this penny toss worksheet, students collect statistical data by tossing pennies and then create a scatter plot of the data. They use formulas for exponential growth and decay and then plot the function. This two-page document...
Curated OER
Integration: Statistics, Scatter Plots and Best-Fit Lines
In this math worksheet, students identify the type (if any) of correlation on 6 scatter plots. They use information given on a table to create a scatter plot and identify the type of correlation. Students use the scatter plot to make...
Lane Community College
Review Sheets: Geometry
Full of problems with polygons, angles, lines, and triangles, your learners get a multi-page packet that provides all they need to know. It contains many of the standard problem types as well as some more challenging questions.
EngageNY
Markup and Markdown Problems
There is a 100 percent chance this resource will help pupils connect percents to financial literacy. Young mathematicians use their knowledge of percents to find markups and markdowns in financial situations in the seventh segment in a...
Inside Mathematics
Conference Tables
Pupils analyze a pattern of conference tables to determine the number of tables needed and the number of people that can be seated for a given size. Individuals develop general formulas for the two growing number patterns and...
Virginia Department of Education
Analyzing and Interpreting Statistics
Use measures of variance to compare and analyze data sets. Pupils match histograms of data sets to their respective statistical measures. They then use calculated statistics to further analyze groups of data and use the results to make...
Noyce Foundation
Time to Get Clean
It's assessment time! Determine your young mathematicians' understanding of elapsed time with this brief, five-question quiz.
Noyce Foundation
Pizza Crusts
Enough stuffed crust to go around. Pupils calculate the area and perimeter of a variety of pizza shapes, including rectangular and circular. Individuals design rectangular pizzas with a given area to maximize the amount of crust and do...
Inside Mathematics
Snakes
Get a line on the snakes. The assessment task requires the class to determine the species of unknown snakes based upon collected data. Individuals analyze two scatter plots and determine the most likely species for five...
Virginia Department of Education
Quadratic Equations
Review the multiple methods of solving quadratic equations through an analysis of the discriminant. Scholars use the discriminant to determine the best solution method and then solve various equations. As a challenge, learners build...
Inside Mathematics
Hexagons
Scholars find a pattern from a geometric sequence and write the formula for extending it. The worksheet includes a table to complete plus four analysis questions. It concludes with instructional implications for the teacher.


