Illustrative Mathematics
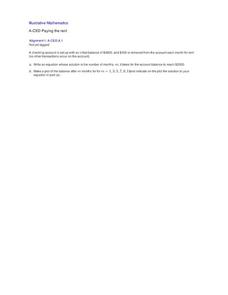
Paying the Rent
Learning how a bank account works is a useful tool. The exercise in the resource is to deduct rent from a checking account and create an equation from a description. Participants then graph the balance of the bank account versus months...
Curated OER
Real Misleading Graphs
Students identify real graphs and misleading graphs. In this algebra lesson, students surf the Internet for real life scenarios where graphs are used in a misleading way as well as in a correct way.
Curated OER
Systems of Equations and Inequalities
This is a comprehensive lesson on creating and solving equations and systems of equations and inequalities. Problems range from basic linear equations to more complex systems of equations and inequalities based on a real-world examples....
Curated OER
Spaghetti Graphs
Young scholars work in pairs to test the strength of spaghetti strands. They collect and graph data to determine a line of best fit. Students create a linear equation to interpret their data. Based on the data collected, young scholars...
EngageNY
Graphs of Piecewise Linear Functions
Everybody loves video day! Grab your class's attention with this well-designed and engaging resource about graphing. The video introduces a scenario that will be graphed with a piecewise function, then makes a connection to domain...
Education Development Center
Geography of the Coordinate Plane
Put the graph into graphing and allow learners to understand the concept of point plotting and how it relates to data. The worksheet provides a nice way to connect data analysis to a graph and make predictions. The worksheets within the...
EngageNY
Nature of Solutions of a System of Linear Equations
If at first you cannot graph, substitute. The lesson introduces the substitution method as a way to solve linear systems if the point of intersection is hard to determine from a graph. The 28th installment of a 33-part series finishes...
Curated OER
Basic Algebra and Computers: Spreadsheets, Charts, and Simple Line Graphs
Students, while in the computer lab, assess how to use Microsoft Excel as a "graphing calculator." They view visual representations of line graphs in a Cartesian plane while incorporating basic skills for using Excel productively.
Curated OER
Build A Skittles Graph
Students explore graphing. In this graphing lesson, students sort Skittles candies and use the color groups to create a bar graph. Rubrics and extension activities are provided.
Curated OER
Graphing at all Levels: It's a Beautiful Thing!
Mixing math and art is done in this lesson by applying graphing knowledge to create a unique piece of art. This lesson varies acording to the graphing knowledge of the artist. First, learners identify and review various types of graphing...
Curated OER
One of the Many Ways
Explore the concept of polynomials and determine the value and number of zeros for a given polynomial using the Rational Root Theorem. Then graph the polynomials and relate the number of zeroes to the degree of the polynomial.
Curated OER
Linear Inequalities in One and Two Variables: Rays and Half Planes
Define rays and half planes, including the concepts of boundary lines and prerequisite knowledge of coordinate planes. Given linear inequalities in one and two variables, your class will compare the differences. They will also graph...
Curated OER
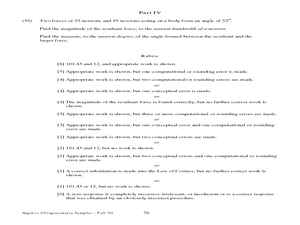
Scoring Guide for the Algebra 2/Trigonometry Test Sampler
Students take an Algebra II/Trigonometry sample test. In this Algebra II/Trigonometry sample sample test lesson, students take a sample test for Algebra 2/Trigonometry. Students solve 39 multiple choice/short answer questions about...
Curated OER
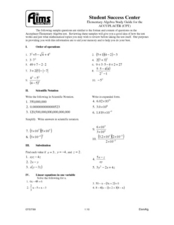
Elementary Algebra Study Guide
Middle and high schoolers solve problems involving linear equations, inequalities, quadratics, radicals, systems of equations, exponents, and polynomials. Many of the problems encompass a review of Algebra I. This 10-page worksheet...
EngageNY
Graphs of Exponential Functions
What does an exponential pattern look like in real life? After viewing a video of the population growth of bacteria, learners use the real-life scenario to collect data and graph the result. Their conclusion should be a new type of graph...
EngageNY
Solving and Graphing Inequalities Joined by “And” or “Or”
Guide your class through the intricacies of solving compound inequalities with a resource that compares solutions of an equation, less than inequality, and greater than inequality. Once pupils understand the differences, the lesson...
EngageNY
Translating Graphs of Functions
If you know one, you know them all! Parent functions all handle translations the same. This lesson examines the quadratic, absolute value, and square root functions. Pupils discover the similarities in the behavior of the graphs when...
EngageNY
Graphing Quadratic Equations from the Vertex Form
Graphing doesn't need to be tedious! When pupils understand key features and transformations, graphing becomes efficient. This lesson connects transformations to the vertex form of a quadratic equation.
EngageNY
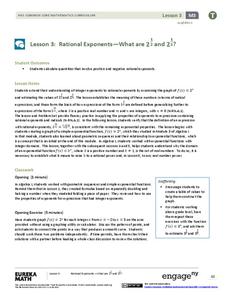
Rational Exponents—What are 2^1/2 and 2^1/3?
Are you rooting for your high schoolers to learn about rational exponents? In the third installment of a 35-part module, pupils first learn the meaning of 2^(1/n) by estimating values on the graph of y = 2^x and by using algebraic...
Curated OER
Graphing Inequalities in One Variable
Students graph inequalities on a number line. In this algebra lesson, students solve linear and compound inequalities and graph them on a number line. They write an inequality given the number line with the solution on it.
EngageNY
Analyzing Residuals (Part 1)
Just how far off is the least squares line? Using a graphing calculator, individuals or pairs create residual plots in order to determine how well a best fit line models data. Three examples walk through the calculator procedure of...
EngageNY
Graphing Cubic, Square Root, and Cube Root Functions
Is there a relationship between powers and roots? Here is a lesson that asks individuals to examine the graphical relationship. Pupils create a table of values and then graph a square root and quadratic equation. They repeat the process...
EngageNY
Modeling with Quadratic Functions (part 1)
Relevance is key! The resource applies quadratic modeling by incorporating application of physics and business. Pupils work through scenarios of projectile motion and revenue/profit relationships. By using the key features of the graph,...
Curated OER
Making Connections: Matrices, Graph, Linear Systems
In this set of activities, matrices and equations are explored. They work with matrices using pen and paper as well as graphing calculator. Additionally real-world problems are explored.


