Curated OER
Frequency Histograms, Bar Graphs and Tables
In this statistics worksheet, students graph their data using frequency histograms, bar graphs and tables. They decide which graph shows the data best. There are 6 graphing problems.
Curated OER
Frequency, Histograms, Bar Graphs and Tables
In this frequency worksheet, students interpret histograms, bar graphs and tables. They examine frequency charts and comparison line graphs. This three-page worksheet contains 4 problems. Answers are provided on the...
Curated OER
Integrated Algebra Practice: Frequency Histograms, Bar Graphs and Tables
In this graphs worksheet, students solve 4 problems about histograms, bar graphs, and tables. Students answer questions about histograms, bar graphs, and tables.
Curated OER
Math Regents Exam Questions - Pearson Integrated Algebra P.304: Histograms
In this histograms worksheet, students solve 9 short answer, multiple choice, and graphing problems. Students construct frequency tables and histograms of data.
Curated OER
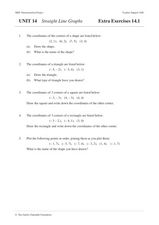
Straight Line Graphs
In this algebra worksheet, students graph coordinate pairs on a coordinate plane. They match points with letters and graph a line through all the plotting to create a straight line. There are 25 questions with an answer key.
Curated OER
Chapter 11 - Objective 1.1 Graphing
In this graphing activity, students graph linear equations and identify the x and y-intercept. This one-page activity contains ten problems.
Curated OER
Chapter 10 - Objective 6.1 Graph
In this graphing worksheet, students solve linear and parabolic equations and graph equations on a coordinate plane. They use the discriminant to determine the number of x-intercepts of a parabola. This one-page worksheet contains ten...
Curated OER
Math Honors 2: Semester 1 Review
In this activity, learners review topics from Algebra 2. Topics include synthetic division, rational algebraic expressions, quadratic functions, imaginary number, composite functions, and inverse of a function. The three-page activity...
Curated OER
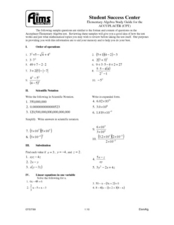
Elementary Algebra Study Guide
Middle and high schoolers solve problems involving linear equations, inequalities, quadratics, radicals, systems of equations, exponents, and polynomials. Many of the problems encompass a review of Algebra I. This 10-page worksheet...
EngageNY
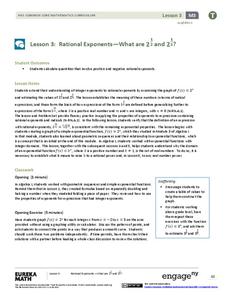
Rational Exponents—What are 2^1/2 and 2^1/3?
Are you rooting for your high schoolers to learn about rational exponents? In the third installment of a 35-part module, pupils first learn the meaning of 2^(1/n) by estimating values on the graph of y = 2^x and by using algebraic...
EngageNY
Analyzing Residuals (Part 1)
Just how far off is the least squares line? Using a graphing calculator, individuals or pairs create residual plots in order to determine how well a best fit line models data. Three examples walk through the calculator procedure of...
Curated OER
Graphing Lines in Slope-Intercept Form
Put it in slope-intercept form! Learners solve linear equations and sketch a graph of the equation on a coordinate plane. This worksheet contains 12 problems and an answer key.
Curated OER
Narrow Corridor
Buying a new sofa? Learn how to use the Pythagorean Theorem, as well as algebra and graphing techniques, to determine whether the sofa will fit around a corner (which I'm sure you'll agree is a very important consideration!).
Virginia Department of Education
Functions 1
Scholars learn what it means for a relation to be a function and see various representations of functions. After learning the definition, they participate in a card sorting activity classifying relations as functions or not.
Illustrative Mathematics
Bike Race
A graph not only tells us who won the bike race, but also what happened during the race. Use this resource to help learners understand graphs. The commentary suggests waiting until the end of the year to introduce this topic, but why...
Curated OER
Graphing Lines
In this graphing lines worksheet, learners graph lines that are in the point-slope form. They identify the y-intercept and the slope. They graph the equation of a line on a coordinate plane. This four-page...
Curated OER
One-Step Inequalities
In this one-step inequality learning exercise, students solve given inequality equations and graph the solution on a number line. This four-page learning exercise contains 24 problems. Answers are provided on the last two pages.
Curated OER
Algebra 1: Unit 5 Review
In this problem solving learning exercise, 6th graders determine if 4 functions are exponential growth or decay, sketch 4 graphs and compare 2 sets of functions. Students write the rule, linear or exponential, for 4 tables.
West Contra Costa Unified School District
Conics Introduction and Parabolas
Where did conic sections get their name? The equation and graph of a parabola are developed from the definition of the conic section. Teacher examples on graphing the equation and writing an equation from the graph round out the plan.
Curated OER
Worksheet 9: Trig Functions
In this math worksheet, students are given 7 problems in which they write expressions for trig functions, compute limits and graph functions.
Illustrative Mathematics
Chocolate Bar Sales
In this real-world example, algebra learners start to get a sense of how to represent the relationship between two variables in different ways. They start by looking at a partial table of values that define a linear relationship. They...
Curated OER
Piecewise Practice Problems
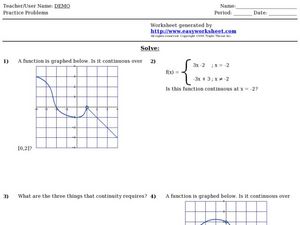
For this algebra worksheet, students validate continuity of a graph by a defined interval as well as determine continuity of a piecewise function.
Curated OER
Graphing Linear Inequalities
In this graphing worksheet, students solve and graph linear inequalities on a coordinate plane. Inequalities contain one variable. The solution set is sketched and colored. This worksheet contains eight problems on two pages, with an...
Curated OER
Graphing Trig Functions
In this graphing trig functions worksheet, students find the amplitude of each function. They graph the function. This four-page worksheet contains 12 problems. Answers are provided on the last two pages.


