Curated OER
Graph Functions with Integers
Fifth graders can do a quick review of graphing functions using integers with this worksheet. The worksheet has questions which require students to identify the pertinent information in a word problem, and create a graph to represent the...
Curated OER
Long Distance Phone Plans
In this long distance phone plane worksheet, students compare various phone plans and determine which long distance plan has the greatest savings. Students support their answers visually through the use of tables and graphs. They write...
Curated OER
Vertex Form of Parabolas
Using the method of completing the square, algebra learners rewrite quadratic equations from standard form to vertex form. They will also graph quadratics, stating the vertex and axis of symmetry. Solutions are provided.
Curated OER
Solving Inequalities
This is a nice learning exercise on solving one variable and compound inequalities. Learners solve inequalities and graph the solution on a number line. The two page learning exercise contains explanation and sixteen practice...
Curated OER
Wacky Water World: Student Worksheet
This well-designed math worksheet invites learners to work in pairs in order to determine which plan is the better value when going to an amusement park. Plan A and Plan B each have different admission fees, and different rates per ride....
West Contra Costa Unified School District
Introduction to Inverse Functions
Ready to share the beauty of the inverse function with your classes? This algebra II lesson guides the discovery of an inverse function through a numerical, graphical, and an algebraic approach. Connections are made between the three,...
Willow Tree
Histograms and Venn Diagrams
There are many different options for graphing data, which can be overwhelming even for experienced mathematcians. This time, the focus is on histograms and Venn diagrams that highlight the frequency of a range of data and overlap of...
Curated OER
Systems of Linear Inequalities
Graphing systems of linear inequalities is the focus of this worksheet. Problems range from checking solutions of inequalities, graphing systems of two inequalities, and graphing systems of three inequalities. Graphing horizontal lines,...
Curated OER
Slope of a Line
In this slope of a line worksheet, students solve and graph 2 different problems that include determining the slope of a line using the equation y=mx+b. First, they define the slope of a line and the y-intercept. Then, students use the...
Curated OER
Exploring Quadratic Graphs
In this algebra worksheet, students solve quadratic equations. They factor and graph their solutions. There are 5 questions with an answer key.
Curated OER
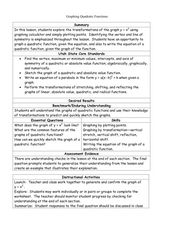
Graphing Quadratic Functions
In this graphing quadratic equations learning exercise, students graph 8 quadratic functions. Coordinate grids are included on the learning exercise.
Curated OER
Graphing Eight Quadratic Inequalities
In this graphing quadratic inequalities worksheet, students graph eight quadratic inequalities. Cartesian coordinate systems and solutions are provided.
Curated OER
Graphing Ordered Pairs
In this graphing ordered pairs instructional activity, 9th graders graph five different sets of numbers on five different graphs. They identify that each of the x-coordinates tells the distance right (positive) or left (negative) and...
Curated OER
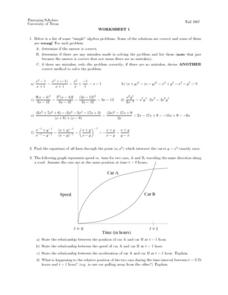
Worksheet 1 - Equation of a Line
In this equation of a line worksheet, students determine the equation of a line, use the distance formula to identify the relationship between two moving objects, and solve inequalities algebraically. This two-page worksheet contains...
West Contra Costa Unified School District
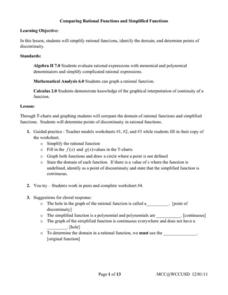
Comparing Rational Functions and Simplified Functions
What kind of functions have holes in their graphs? Here, the teacher guides the class on how to use the simplified function of a rational function to aid in the graphing of the original rational function. T-tables are used in order...
West Contra Costa Unified School District
Solving Systems of Inequalities
Don't throw away those transparency sheets just yet! Young scholars first review inequalities on a number line, then learn about graphing inequalities in the coordinate plane. Finally, they use overhead transparencies to create systems...
West Contra Costa Unified School District
Solving a System by Substitution
Solving systems by substitution can be a challenging topic in algebra I. Here is a lesson that builds on students' understanding of intercepts to begin the process of substitution, and all work is reinforced graphically to build...
Shmoop
Box, Stem-Leaf, and Histogram
A helpful and versatile instructional activity requires young mathematicians to analyze data in order to create graphs and answer questions. Additionally, it prompts learners to find the mean, median, mode, and range of some of...
Curated OER
6.5 Absolute-Value Equations and Inequalities
In this absolute value equations worksheet, students solve absolute-value equations and inequalities. They graph answers on a number line. This one-page worksheet contains 34 problems.
Curated OER
Graphing Lines
For this algebra worksheet, 9th graders are given a linear equation and asked to graph the lines. There are 12 questions with an answer key.
Curated OER
Graphing Linear Inequalities
In this Algebra I worksheet, 9th graders graph the solution of the given linear inequalities. The two page worksheet contains twelve problems. Solution key is provided.
Curated OER
Graphing Quadratic Functions
In this math worksheet, students write 8 equations of the axis of symmetry and find the coordinates of each quadratic function. Students graph 4 of the equations and state if the vertex is maximum or minimum.
Curated OER
Investigating Parabolas
In this investigating parabolas worksheet, 9th graders solve and graph 7 different problems that include graphing various equations that represent parabolas. First, they sketch their graphs to each problem. Then, students determine what...
Curated OER
Gra[hing Linear Equations
In this Algebra I worksheet, 9th graders use the slope and y-intercept to graph a linear equation and fill in a table with the coordinates of the five points plotted. The seven page worksheet contains fourteen problems. ...


