EngageNY
Awkward! Who Chose the Number 360, Anyway?
Don't give your classes the third degree. Use radians instead! While working with degrees, learners find that they are not efficient and explore radians as an alternative. They convert between the two measures and use radians with the...
EngageNY
The Height and Co-Height Functions of a Ferris Wheel
Show learners the power of mathematics as they model real-life designs. Pupils graph a periodic function by comparing the degree of rotation to the height of a ferris wheel.
West Contra Costa Unified School District
Comparing Rational Functions and Simplified Functions
What kind of functions have holes in their graphs? Here, the teacher guides the class on how to use the simplified function of a rational function to aid in the graphing of the original rational function. T-tables are used in order to...
EngageNY
The Remainder Theorem
Time to put it all together! Building on the concepts learned in the previous lessons in this series, learners apply the Remainder Theorem to finding zeros of a polynomial function. They graph from a function and write a function from...
EngageNY
A Surprising Boost from Geometry
Working with imaginary numbers — this is where it gets complex! After exploring the graph of complex numbers, learners simplify them using addition, subtraction, and multiplication.
West Contra Costa Unified School District
Solving Systems of Inequalities
Don't throw away those transparency sheets just yet! Young scholars first review inequalities on a number line, then learn about graphing inequalities in the coordinate plane. Finally, they use overhead transparencies to create systems...
West Contra Costa Unified School District
Solving a System by Substitution
Solving systems by substitution can be a challenging topic in algebra I. Here is a lesson that builds on students' understanding of intercepts to begin the process of substitution, and all work is reinforced graphically to build...
EngageNY
The Definition of a Parabola
Put together the pieces and model a parabola. Learners work through several examples to develop an understanding of a parabola graphically and algebraically.
Texas Instruments
Function Notation - Texas Instruments
Using a TI-Nspire calculator, learners will work to better understand function notation and input/output functions. They write equations with a function symbols, identify what makes an equation a function, and graph lines in order to...
Curated OER
Graphing Quadratic Functions
In this math worksheet, students write 8 equations of the axis of symmetry and find the coordinates of each quadratic function. Students graph 4 of the equations and state if the vertex is maximum or minimum.
Curated OER
Using Data Analysis to Review Linear Functions
Using either data provided or data that has been collected, young mathematicians graph linear functions to best fit their scatterplot. They also analyze their data and make predicitons based on the data. This lesson is intended as a...
Curated OER
Graphing Functions With 2 Points and From a Graph
Students plot points on a coordinate plane. They describe, in words, methods for finding the slope of a line. After given a worksheet, students read instructions, draw a Cartesian plane, plot ordered pairs, and graph lines. Papers are...
Curated OER
Algebra I Project: Make Your Own Business
Students explore the concept of algebra in real world situations. In this economics lesson, students design, plan, run, and evaluate a small business. Students will create a product, market the product, and try to make a profit.
Curated OER
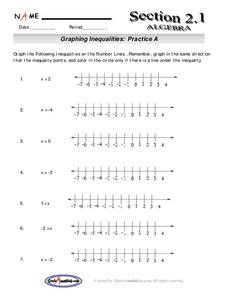
Graphing Inequalities
Students graph inequalities on a number line and discuss how to solve for one variable. The teacher models examples as students take notes. In groups, students participate in an activity to demonstrate inequalities on a number line. ...
Curated OER
Algebra—Quadratic Equations and Functions
Students use given information on wind speed with the quadratic formula to determine the pressure of the wind on a building. In this quadratic equations lesson, students compute the pressure of the wind from two data tables. They graph...
Curated OER
Graphing Linear Equations Using Data Tables
Students review the Cartesian plane and the process of plotting points. In groups, students create tables, identify the slope and y-intercept, and graph the equation. Afterward, students perform the same process, only, individually. As a...
Curated OER
Functions and Graphs -- Pattern Detection #1
Students discuss the job of an archaeologist by determining how people have used their environment. Using a graph, they analyze the patterns and functions of Native Americans in Arizona using maize. They work together to answer...
Curated OER
Functions of Algebra
Students use technology graph and evaluate linear inequalities. They write and manipulate inequalities for use on a graphing calculator. In addition they apply their skills to analyze inequalities. Answer Key included.
Curated OER
Stories to Graphs
Learners graph their solutions using a linear equation. In this algebra lesson, students rewrite words problems into algebraic equations and graph their solutions. They solve word problems dealing with real lie scenario.
Curated OER
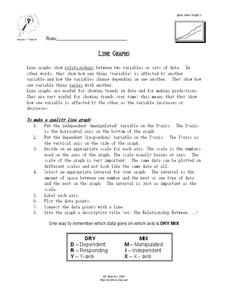
Line Graphs
In this algebra worksheet, students describe the relationship between a line graph and its data. They define the reasons line graphs are used and discuss increasing and decreasing lines. There is one involved questions, requiring several...
Curated OER
Graphs of Direct Variation
Students identify graphs for direct variation. In this algebra worksheet, students analyze graphs to determine their direct variation. They also determine whether the graphs are functions or not.
Curated OER
Analyzing Graphs of Two Equations
Students analyze graphs of two equations. For this algebra lesson, students rewrite word problems as linear equations. They graph their solution and compare and contrast the two items being represented.
Curated OER
Graphing Inequalitites
Ninth graders graph inequalities. In this algebra lesson, 9th graders graph equations on a number line using inequalities and plain numbers. They solve inequalities with negative numbers also.
Curated OER
Graphs and Direct Variation
Students solve problems with direct variation. In this algebra instructional activity, students analyze graphs to figure out the direct variation of a line. They observe the slopes based the steepness of the lines.


