Alabama Learning Exchange
Bloodstain Pattern Doesn't Lie......
An interesting instructional activity on hypothesizing about the diameter of a drop of blood that is splattered. To test their theories, learners work in groups to make blood droplets splatter from different heights. They use graphed...
Curated OER
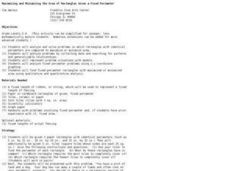
Maximizing and Minimizing the Area of Rectangles Given a Fixed Perimeter
Students explore the realms of measurement. In this math lesson plan, students analyze and solve problems in which rectangles with identical perimeters are compared to maximize or minimize area. This lesson can be extended for algebra,...
Curated OER
Hyperbolas: Sketching from the Equation
In this algebra worksheet, students sketch graphs of hyperbolas after solving equations to standard form and interpreting the center, vertices, foci, axis, asymptotes, and eccentricity from the equation. There are 58 questions.
Curated OER
Microteaching
Tenth graders use the mathematical program, MATHEMATICA and graph linear and quadratic equations. They sketch the graph of an equation manually. Students compare their sketch with the computer generated model of the graph.
Curated OER
Graphing Equations
Students use an interactive website or cd rom to graph equations. The lesson plan is not very clearly written. The use of the website is essential or the educational software that can be purchased from the Prentice Hall publisher.
Curated OER
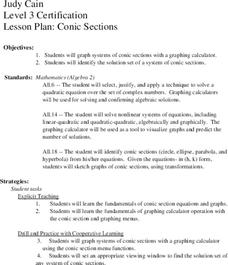
Conic Sections
Students, while using a graphing calculator, graph systems of conic sections as well as identify their solutions. They complete various word problems dealing with conic sections with their calculators. In addition, students sketch graphs...
Curated OER
Effects of Parameter Changes
Young scholars define properties of a quadratic equation. In this algebra lesson, students graph and factor quadratic functions. They write equations for polynomials, given a graph.
Curated OER
Introduction To Functions
Students define a functions and solve problems using functions. In this algebra lesson, students differentiate functions from non-functions. They differentiate between polynomials of higher degrees.
Alabama Learning Exchange
Explore the Transformations of Linear and Absolute Value Functions Using Graphing Utilities
Students explore the concept of transformations. For this transformation lesson, students use an applet that is an interactive absolute value graph applet. Students manipulate the applet to examine the change in the function and how it...
Curated OER
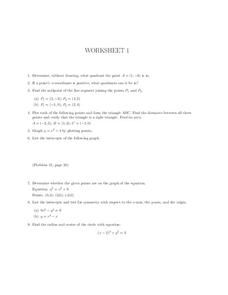
Worksheet 1, Coordinate Graphing
In this algebra worksheet, students determine the quadrant a given point is in. They find the midpoints of two line segments. Students plot points to form a triangle and find the distance between points. Students find the area of the...
Curated OER
Strike a Pose: Modeling in the Real World (There's Nothing to It!)
Adjust this lesson to fit either beginning or more advanced learners. Build a scatter plot, determine appropriate model (linear, quadratic, exponential), and then extend to evaluate the model with residuals. This problem uses real-world...
Curated OER
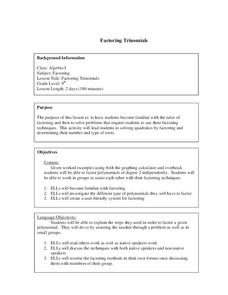
Factoring Trinomials
Learners factor trinomials correctly. For this algebra lesson, students review the rules for factoring trinomials. They factor different polynomials as they relate the same concept and idea to facoring trinomials.
Virginia Department of Education
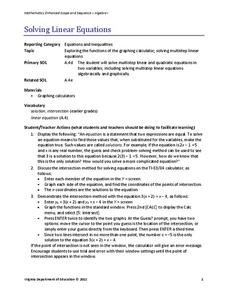
Solving Linear Equations
Practice solving linear equations by graphing. Scholars learn to solve multi-step linear equations in one variable by graphing both sides of the equation separately. They use graphing calculators to find the intersection of the graphs.
Curated OER
Investigation - Looking For Triangles
Seventh graders investigate a series of triangles, looking for patterns and generalizing what they have found. They analyze the pattern data and organize it into a table and graph. Students identify the relationship and discover the rule...
Curated OER
How Alike Are We?
Fourth graders find the range, mode, median, and mean for each of the data sets (height and shoe size). They discuss which measure of central tendency for each data set best represents the class and why. Students graph the shoe size and...
Alabama Learning Exchange
As If Numbers Weren't Complex Enough Already!
The class explores the concept of complex numbers on a website to generate their own Mandelbrot sets. They will practice performing operations with complex numbers and then to get a visual understanding, graph the absolute value of a...
Mathematics Assessment Project
Representing Functions of Everyday Situations
Functions help make the world make more sense. Individuals model real-world situations with functions. They match a variety of contexts to different function types to finish a helpful resource.
Curated OER
Big Wheels Keep on Turning
Eleventh graders work in groups and investigate how force determines the speed and distance then they view the video, "Math Vantage #7: What's Your Angle?." They are given a real life problem to solve using speed, ramps, angle, incline...
Curated OER
Discriminant Testing
The class works to identify solutions using the discriminant.They use part of the quadratic formula to find the number of solutions a quadratic equation will have. They calculate how-many times the quadratic function will cut the x-axis....
Curated OER
Functions and Inverses
Learners solve problems identifying the functions and inverses. In this algebra lesson, students identify a one-to-one function, and perform the horizontal line test. They analyze data and graph their results on a graph.
Curated OER
Transformations and Exponential Functions
Tenth graders study graphing exponential functions. In this transformations lesson, 10th graders apply inquiry to determine how changes to a parent function affect its graph. Students analyze transformed graphs and generate the function...
Curated OER
Celsius to Fahrenheit
Students convert degrees between two different units. In this algebra lesson, students graph linear equations and identify the line of best fit. They use their line of best fit to make predictions given a set of data.
Curated OER
Iterating the Function and Complex Numbers
Learners identify the end behavior of polynomial graphs. In this algebra lesson, students factor and solve quadratic and complex equations. They factor out negative roots and identify the real and imaginary parts of an equation.
Curated OER
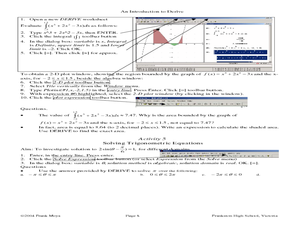
An Introdcution to Derive
Twelfth graders explore Derive. In this Calculus lesson plan, 12th graders investigate the menus and tools available in Derive. In addition to the familiarization part of the lesson plan, students investigate Pascal’s Triangle,...


