Curated OER
Mathematics Module
Delve into graphing! The concepts covered begin with basic graphing basic coordinates and algebraic expressions on coordinate planes, and build up to graphing linear inequalities and equations. Learners solve and simplify various...
PBS
Add, Subtract and Multiply Fractions
Your future chefs will appreciate this comprehensive lesson where learners practice operations on fractions using pizza and soup analogies. Learners begin with a pizza analogy that requires the learners to multiply a whole number by a...
Curated OER
Graphing Systems of Inequalities
Solve equations and graph systems of inequalities. Designed as a lesson plan to reinforce these concepts, learners revisit shading and boundaries along with solving linear inequalities.
West Contra Costa Unified School District
Using Bar Models to Solve Rate Problems
Pupils visualize distance-rate-time problems by using bar models. The lesson plan presents examples of four different types of rate problems and shows how they can be solved using bar models and equations. Each example is followed by a...
EngageNY
Special Triangles and the Unit Circle
Calculate exact trigonometric values using the angles of special right triangles. Beginning with a review of the unit circle and trigonometric functions, class members use their knowledge of special right triangles to find the value of...
EngageNY
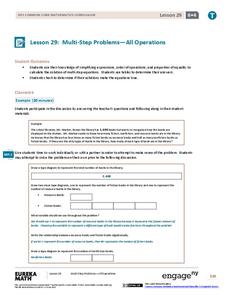
Multi-Step Problems—All Operations
Harness the power of algebra to solve problems. Young mathematicians learn to work out multi-step problems by applying algebraic techniques, such as solving equations and proportions. They use tape diagrams to model the problem to finish...
Curated OER
Sea Turtle Math
Students consider the future of endangered species. In this conservation activity, students view a slide show and use mathematical data to construct a prediction for the survival of an endangered species. This activity includes, personal...
National Security Agency
Ordering, Adding and Subtracting Integers
Prealgebrarians use colored chips, stickers, and pencils to explore the world of integers. They discover absolute value, compare positive and negative integers, and apply operations to them. A detailed procedure for the three-part lesson...
West Contra Costa Unified School District
Solving Equations Using Balance Scale, Decomposition, and Graphing
There's more than one way to solve an equation — three, actually. Scholars learn how to solve simple linear equations in one variable using three different methods, which include using balance scales, using decomposition (e.g., turning...
Virginia Department of Education
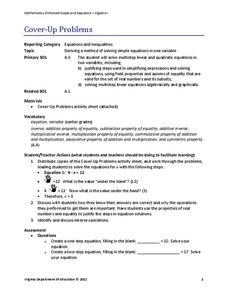
Cover Up Problems
Don't cover up this resource — use it out in the open! Pupils learn how to cover up various parts of a linear equation in order to help solve the equation. A worksheet of problems provides practice with this skill.
Annenberg Foundation
Skeeters Are Overrunning the World
Skeeters are used to model linear and exponential population growth in a wonderfully organized lesson plan including teachers' and students' notes, an assignment, graphs, tables, and equations. Filled with constant deep-reaching...
Ohio Department of Education
The Solution is Complex
Consider complex numbers, roots, and quadratic equations. Use the discriminate as a way to determine the nature of a quadratic's roots. Then discuss the similarities and differences between quadratics with two, one, or no real roots....
Curated OER
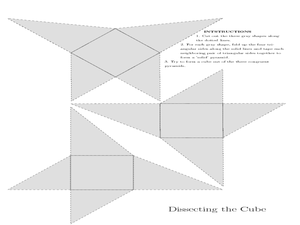
Dissecting the Cube
Students investigate the volume of cones. In this geometry lesson plan, students define the formula to find the volume of cones. They define the concept of having to dissect a three dimensional figure and find the volume.
EngageNY
Solving Problems Using Sine and Cosine
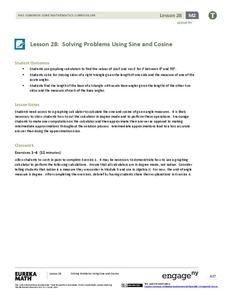
Concepts are only valuable if they are applicable. An informative resource uses concepts developed in lessons 26 and 27 in a 36-part series. Scholars write equations and solve for missing side lengths for given right triangles. When...
Teach Engineering
Graphing Equations on the Cartesian Plane: Slope
Slopes are not just for skiing. Instructors introduce class members to the concept of slope and teach them how to calculate the slope from a graph or from points. The lesson also includes the discussion of slopes of parallel and...
PBS
Patterns to the Rescue!
Track down the Cyberchase episode that this instructional activity is associated with. Using a worksheet that is embedded in the plan, learners must find the next two numbers and shapes (a double pattern). Once these have been...
Curated OER
Mathematical Modeling
Study various types of mathematical models in this math lesson. Learners calculate the slope to determine the risk in a situation described. They respond to a number of questions and analyze their statistical data. Then, they determine...
Fredonia State University of New York
Watch Your Step…You May Collide!
Can two lines intersect at more than one point? Using yarn, create two lines on the floor of the classroom to find out. Cooperative groups work through the process of solving systems of equations using task cards and three different...
EngageNY
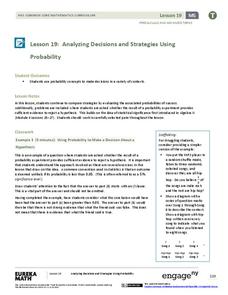
Analyzing Decisions and Strategies Using Probability 2
Explore how to compare and analyze different strategies. In the 20th installment of a 21-part module, scholars continue their analysis of decisions and strategies from the previous lesson. They then extend this concept to hypothesis...
EngageNY
Revisiting the Graphs of the Trigonometric Functions
Use the graphs of the trigonometric functions to set the stage to inverse functions. The lesson reviews the graphs of the basic trigonometric functions and their transformations. Pupils use their knowledge of graphing functions to model...
Mathematics Assessment Project
Modeling Motion: Rolling Cups
Connect the size of a rolling cup to the size of circle it makes. Pupils view videos of cups of different sizes rolling in a circle. Using the videos and additional data, they attempt to determine a relationship between cup measurements...
EngageNY
Nonlinear Motion
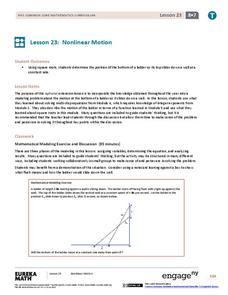
Investigate nonlinear motion through an analysis using the Pythagorean Theorem. Pupils combine their algebraic and geometric skills in the 24th lesson of this 25-part module. Using the Pythagorean Theorem, scholars collect data on the...
Curated OER
Linear Regression and Correlation
Learners explore scatter plots. In this linear regression lesson, groups of pupils graph scatter plots and then find the line of best fit. They identify outliers and explain the correlation. Each group summarizes and shares their...
Curated OER
Linear and Quadratic Model, Data Modeling
Students model quadratic and linear equations. In this algebra lesson, students solve word problems using equations. They create scatter plots and make predictions using correlations.


