Curated OER
Percents and Discounts
Students convert between decimals and percents. In this algebra lesson, students define percent as it relates to sales and tax. They calculate the percents of number using multiplication.
Curated OER
Jambalaya's Restaurant
Young scholars use a menu and recipes to work on adding, subtracting, and percentages. They are given they weekly circulators, advertisements, or actual products and students practice figuring out sales tax. Young scholars figure slaes...
Kenan Fellows
Isotopic Pennies
Many people confuse atomic mass and atomic numbers. The sixth of seven lessons in a unit requires scholars to find the weight of different groups of pennies. Then, they must solve how many of each type of penny exists in a closed system...
Curated OER
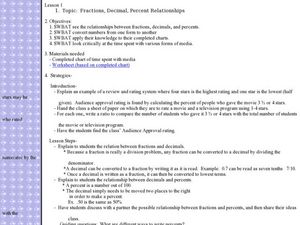
Fractions, Decimal, Percent Relationships.
Students solve problems involving fractions, decimals and percents. In this algebra lesson, students examine the relationship between fractions and percents and between decimals and percents. They convert between percents, decimals and...
Curated OER
A Beating Heart
Students collect and analyze data using percent difference. In this algebra lesson, students relate the concepts of algebra to cardiac physiology.
Curated OER
Our Solar System - Comparing Planetary Travel Distances
NASA presents a mini-unit on distances in our solar system. It incorporates scientific concepts of gravity, mass, density, and payload while your aspiring astronauts also employ mathematics skills. They calculate speed, they determine...
Curated OER
Estimating With Fire
Students solve problems with percents, decimals and fractions. In this algebra lesson, students convert between fractions, percents and decimals. They estimate their answers and calculate their answer.
Curated OER
Finding Total Given Part and Percentage
Students observe models of fractional parts. After writing the definitions of percent, part and whole, students use the calculators and computers to solve problems. Individually, they complete assigned problems where the convert the...
EngageNY
Comparing Distributions
Data distributions can be compared in terms of center, variability, and shape. Two exploratory challenges present data in two different displays to compare. The displays of histograms and box plots require different comparisons based...
EngageNY
Why Do Banks Pay YOU to Provide Their Services?
How does a bank make money? That is the question at the based of a lesson plan that explores the methods banks use to calculate interest. Groups compare the linear simple interest pattern with the exponential compound interest pattern.
Curated OER
Review of Algebra Topics
Eighth graders participate in a lesson that is intended to review topics of Algebra.They investigate the concepts of percent and solve problems. Students also solve equations that involve percent of change.
Curated OER
Interactivate: Introduction to Functions
This interactive website provides a variety of lesson plans according to which standards you are applying and which textbook you use. Introduce functions to your class by having them construct single operation machines and create...
Willow Tree
Weighted Averages
Mixtures, weighted percentages, and varying speeds make problem solving difficult. The resource give learners a strategy for tackling these types of problems effectively.
Curated OER
I want a credit card--or do I?
Students pretend to borrow $1000.00 on a credit card. They pretend to make the minimum payments for a year. When they're done, they make a pie chart showing how much of their payments reduced their debt, and how much was interest.
Curated OER
When Am I Ever Going to Use this?
Learners solve problems using equations and properties of integers. In this algebra lesson, students solve problems using ratio and proportion and graph their answers on a coordinate plane. They solve word problems using geometry.
Curated OER
Managing a Checkbook
How do grown ups do it? Teach your upper graders the ins and outs of personal finance by having them use their algebra skills to balance a checkbook. They examine the financial side of math, set up a checking account, and balance their...
Curated OER
Using Inequalities to Problem Solve
Students explore inequalities. In this Algebra I lesson, students solve and graph linear inequalities involving addition, subtraction, multiplication, or division. Students use inequalities to solve and graph real-world problems.
Curated OER
Online video games plus curriculum-based math equals an engaging educational tool.
Seventh graders use online math games to practice understanding the skill of estimation and order of operations. In this lesson, 7th graders use the internet to play online games to strengthen their understanding of these skills.
EngageNY
Using a Curve to Model a Data Distribution
Show scholars the importance of recognizing a normal curve within a set of data. Learners analyze normal curves and calculate mean and standard deviation.
EngageNY
Analyzing a Data Set
Through discussions and journaling, classmates determine methods to associate types of functions with data presented in a table. Small groups then work with examples and exercises to refine their methods and find functions that work to...
Curated OER
Using Ratios to Taste the Rainbow
Students solve problems using ratios and proportion. In this algebra lesson, students analyze skittles and their different colors as they apply the properties of ratios and proportions to solve their problems.
Curated OER
Rate of Change
Eleventh graders solve problems dealing with rate of change. In this algebra activity, 11th graders graph their rate of change problems and analyze it comparing their data with each other. They solve problems dealing with percent and...
Curated OER
Mixing Up Ratios
Students solve problems of ratio and proportions using hands on. For this algebra lesson, students vary the concentration of a fruit drink using parts of a ratio.
Curated OER
Infusing Equity in the Classroom by Gender
Students investigate the idea of gender descrimination in the classroom. For this algebra lesson, students collect data in stereotyping, and gender bias in the classroom, school materials and activities. They graph and analyze their...


