EngageNY
Proving Trigonometric Identities
Young mathematicians first learn the basics of proving trigonometric identities. They then practice this skill on several examples.
EngageNY
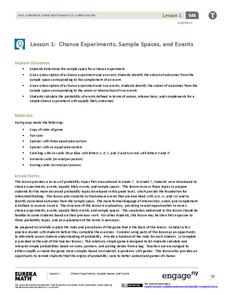
Chance Experiments, Sample Spaces, and Events
Want a leg up on the competition? Show classes how to use mathematics to their advantage when playing games. Learners calculate probabilities to determine a reasonable scoring strategy for a game.
EngageNY
Evaluating Reports Based on Data from a Sample
Statistics can be manipulated to say what you want them to say. Teach your classes to be wise consumers and sort through the bias in those reports. Young statisticians study different statistical reports and analyze them for...
EngageNY
Experiments and the Role of Random Assignment
Time to experiment with mathematics! Learners study experimental design and how randomization applies. They emphasize the difference between random selection and random assignment and how both are important to the validation of the...
EngageNY
Rational and Irrational Numbers
Back to the basics: learning how to add numbers. The 17th installment of a 35-part module first reviews addition techniques for rational numbers, such as graphical methods (number line) and numerical methods (standard algorithm). It goes...
EngageNY
Graphing the Logarithmic Function
Teach collaboration and communication skills in addition to graphing logarithmic functions. Scholars in different groups graph different logarithmic functions by hand using provided coordinate points. These graphs provide the basis for...
EngageNY
The Graph of the Natural Logarithm Function
If two is company and three's a crowd, then what's e? Scholars observe how changes in the base affect the graph of a logarithmic function. They then graph the natural logarithm function and learn that all logarithmic functions can be...
EngageNY
Bean Counting
Why do I have to do bean counting if I'm not going to become an accountant? The 24th installment of a 35-part module has the class conducting experiments using beans to collect data. Learners use exponential functions to model this...
EngageNY
Recursive Challenge Problem—The Double and Add 5 Game
Math is all fun and games! Use a game strategy to introduce the concept of sequences and their recursive formulas. The activity emphasizes notation and vocabulary.
Curated OER
Weighted Averages
Weighted averages can be tricky to explain! However, this study guide makes it easy for teachers by including definitions, explanations, and breaking down problems into three steps. Includes mixture problems and uniform motion problems.
EngageNY
Measuring Variability for Symmetrical Distributions
How do we measure the deviation of data points from the mean? An enriching activity walks your class through the steps to calculate the standard deviation. Guiding questions connect the steps to the context, so the process...
EngageNY
More on Modeling Relationships with a Line
How do you create a residual plot? Work as a class and in small groups through the activity in order to learn how to build a residual plot. The activity builds upon previous learning on calculating residuals and serves as a...
EngageNY
Modeling Relationships with a Line
What linear equation will fit this data, and how close is it? Through discussion and partner work, young mathematicians learn the procedure to determine a regression line in order to make predictions from the data.
EngageNY
Summarizing Bivariate Categorical Data
How do you summarize data that cannot be averaged? Using an exploratory method, learners complete a two-way frequency table on super powers. The subject matter builds upon 8th grade knowledge of two-way tables.
EngageNY
Analyzing Residuals (Part 2)
Learn about patterns in residual plots with an informative math lesson. Two examples make connections between the appearance of a residual plot and whether a linear model is the best model apparent. The problem set and exit ticket...
EngageNY
Relationships Between Two Numerical Variables
Working in small groups and in pairs, classmates build an understanding of what types of relationships can be used to model individual scatter plots. The nonlinear scatter plots in this lesson on relationships between two numerical...
EngageNY
Graphs of Quadratic Functions
How high is too high for a belly flop? Learners analyze data to model the world record belly flop using a quadratic equation. They create a graph and analyze the key features and apply them to the context of the video.
EngageNY
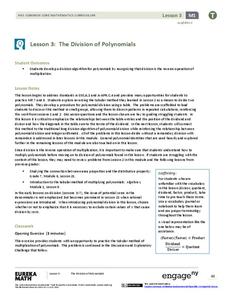
The Division of Polynomials
Build a true understanding of division of polynomials. Learners use their knowledge of multiplying polynomials to create an algorithm to divide polynomials. The area model of multiplication becomes the reverse tabular method of division.
EngageNY
Dividing by (x – a) and (x + a)
Patterns in math emerge from seemingly random places. Learners explore the patterns for factoring the sum and differences of perfect roots. Analyzing these patterns helps young mathematicians develop the polynomial identities.
EngageNY
Radicals and Conjugates
Make the irrational rational again! Continuing the theme from previous lessons in the series, the lesson relates the polynomial identity difference of squares to conjugates. Learners develop the idea of a conjugate through analysis and...
EngageNY
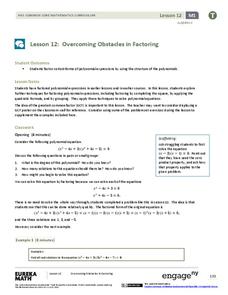
Overcoming Obstacles in Factoring
What do you do when factoring doesn't work? Learners complete the square when faced with quadratic expression that don't factor traditionally. They then use factoring by grouping to solve polynomial equations.
EngageNY
Mastering Factoring
Math class is full of drama—there are so many problems to work out! Pupils work out factoring problems. They use quadratic methods of factoring higher degree polynomials, in addition to factoring the sum and difference of two...
EngageNY
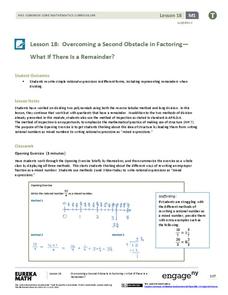
Overcoming a Second Obstacle in Factoring—What If There Is a Remainder?
Looking for an alternative approach to long division? Show your classes how to use factoring in place of long division. Increase their fluency with factoring at the same time!
EngageNY
The Height and Co-Height Functions of a Ferris Wheel
Show learners the power of mathematics as they model real-life designs. Pupils graph a periodic function by comparing the degree of rotation to the height of a ferris wheel.


