Howard County Schools
Constant Rate Exploration
Question: What do rectangles and bathtub volume have in common? Answer: Linear equations. Learn how to identify situations that have constant rates by examining two different situations, one proportional and one not proportional.
Shodor Education Foundation
InteGreat
Hands-on investigation of Riemann sums becomes possible without intensive arithmetic gymnastics with this interactive lesson plan. Learners manipulate online graphing tools to develop and test theories about right, left, and midpoint...
EngageNY
Average Rate of Change
Learners consider the rate of filling a cone in the 23rd installment of this lesson series. They analyze the volume of the cone at various heights and discover the rate of filling is not constant. The lesson ends with a discussion of...
Federal Reserve Bank
Cash Flow and Balance Sheets
What is your car worth? How much do you owe? Individuals create their personal cash flow and balance sheets. They learn the difference between an asset and liability using their personal information to complete the activity.
Illustrative Mathematics
Joining Two Midpoints of Sides of a Triangle
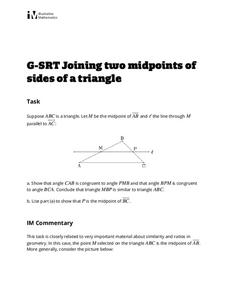
Without ever using the actual term, this exercise has the learner develop the key properties of the midsegment of a triangle. This task leads the class to discover a proof of similar triangles using the properties of parallel lines cut...
EngageNY
Completing the Square (part 2)
Give classes confidence in completing the square with a resource that develops the process of completing the square of more complex problems, including fractions and values greater than one. It then uses quadratic modeling for profit and...
Virginia Department of Education
Square Patios
Build a patio from toothpicks and marshmallows to analyze functions! Learners look for patterns in the data as they create different size patios. As they discover patterns, they make connections between the different representations of...
Curated OER
Graphing Exponentials
Bring your Algebra class to the computer lab! Using materials created by Texas Instruments, they explore exponentiasl and graphs. Be sure to download the correct materials (on the right side of the webpage) before having them walk...
EngageNY
Comparing Quantities with Percent
Be 100 percent confident who has the most and by how much. Pupils use percentages to help make the comparisons by finding what percent one quantity is of the other. They also determine the percent differences between the two quantities.
Curated OER
Exploring Expressions
Examine parts of an expression in this algebra instructional activity. Ninth graders identify the properties of the coefficient and their behavior to the graph. They graph the equation on a TI to see their results.
Curated OER
Linear Programming
Learners explore inequalities to determine the optimal solution to maximize a profit for a company. In this linear programming lesson, students discover how to graph inequalities and how to determine the algebraic representation of a...
Curated OER
Equal Differences Over Equal Intervals 2
Your algebra learners explore linear functions concretely using tables of values in a collaborative task. The idea that linear function values change by equal differences over equal intervals, is emphasized. The slope and y-intercept...
Chicago Teachers Union Quest Center
Factored Form of a Quadratic Function
Build upon linear functions to learn about quadratics. The lesson introduces the concept of zeros for quadratic functions and makes the connection to the linear factors of the function. It presents quadratics in both graphical and...
EngageNY
Properties of Trigonometric Functions
Given a value of one trigonometric function, it is easy to determine others. Learners use the periodicity of trigonometric functions to develop properties. After studying the graphs of sine, cosine, and tangent, the instructional...
Curated OER
Get the Picture!
Astronomers practice downloading data from a high-energy satellite and translate the data into colored or shaded pixels. As a hands-on activity, they use pennies to simulate high-energy satellite data and they convert their penny...
Curated OER
Carbon 14 Dating
Evaluating and analyzing exponential functions will help your archaeologists find the amount of Carbon 14 remaining in a plant in this real-life task centered on carbon dating. Learners will also be introduced to the concept of half-life.
EngageNY
Criterion for Perpendicularity
The Pythagorean Theorem is a geometry pupil's best friend! Learners explain the equation a1b1 + a2b2 = 0 for perpendicular segments using the Pythagorean Theorem. They are able to identify perpendicular segments using their endpoints and...
Curated OER
Maximize area
For this subscription-based activity, algebra learners model changes in the length and width of a rectangle to determine the maximum area possible for a given perimeter and solve several application problems involving area, included in...
Illustrative Mathematics
Telling a Story With Graphs
Turn your algebra learners into meteorologists. High schoolers are given three graphs that contain information about the weather in Santa Rosa, California during the month of February, 2012. Graph one shows temperatures, graph two...
Curated OER
Solution Sets
Here is a task that gives the graph of the solutions of a system of linear inequalities and asks learners to analyze and write the algebraic form of the systems. By turning the problem around, learners make the connections between...
Curated OER
Cantor Set
Discover an interesting mathematical object that your algebra learners will enjoy investigating. Their adventure will lead them to the generation of a finite geometric series.
EngageNY
Perimeter and Area of Polygonal Regions Defined by Systems of Inequalities
When algebra and geometry get together, good things happen! Given a system of inequalities that create a quadrilateral, learners graph and find vertices. They then use the vertices and Green's Theorem to find the area and perimeter of...
West Contra Costa Unified School District
The Extreme Value Theorem
Finding the critical numbers of a function can be extreme. The lesson introduces the Extreme Value Theorem to the class with a graph. Pupils then have an opportunity to practice determining the values using an algebraic function.
Mathematics Assessment Project
Generalizing Patterns: The Difference of Two Squares
After completing an assessment task where they express numbers as the difference of squares (i.e., 9 = 5^2 – 4^2), class members note any patterns that they see in the problems.


