EngageNY
Summarizing Bivariate Categorical Data
How do you summarize data that cannot be averaged? Using an exploratory method, learners complete a two-way frequency table on super powers. The subject matter builds upon 8th grade knowledge of two-way tables.
EngageNY
Relationships Between Two Numerical Variables
Is there another way to view whether the data is linear or not? Class members work alone and in pairs to create scatter plots in order to determine whether there is a linear pattern or not. The exit ticket provides a quick way to...
Education Development Center
Area and Multiplication
Take some intellectual fun and apply it to the concept of multiplying expressions together. A guide models how to break two numbers into an area model to multiply together in pieces similar to FOILing. The rest of the puzzles consist of...
Teach Engineering
Edible Rovers (High School)
Design and build a rover ... then eat it? This activity has groups of two design and build Mars rovers. The teams determine what instruments they want to include with their rover and plan a budget. They calculate the cost of the body of...
Education Development Center
Algebraic Habits of Mind
Math really is just one big puzzle waiting to be solved. Show learners that math can be intriguing and provide them with visually engaging problems and puzzles. The focus is on solving simple equations and looking at expressions.
EngageNY
Interpreting Residuals from a Line
What does an animal's gestation period have to do with its longevity? Use residuals to determine the prediction errors based upon a least-square regression line. This second lesson on residuals shows how to use residuals to create a...
Curated OER
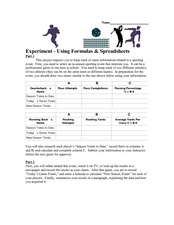
Experiment-Using Formulas and Spreadsheets
In this Algebra I worksheet, 9th graders track information relating to a sporting event and create a spreadsheet and appropriate formulas used to track data. The one page worksheet contains the assignment and...
Education Development Center
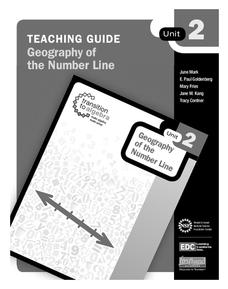
Geography of the Number Line
It's more than just numbers on a line, its an organizational, mental math machine to help learners understand the value of numbers. The tool is handy when introducing positive and negative integers to see their values and...
Education Development Center
Micro-Geography of the Number Line
Young mathematicians dive into the number line to discover decimals and how the numbers infinitely get smaller in between. They click the zoom button a few times and learn that the number line doesn't just stop at integers. Includes...
Education Development Center
Geography of the Coordinate Plane
Put the graph into graphing and allow learners to understand the concept of point plotting and how it relates to data. The worksheet provides a nice way to connect data analysis to a graph and make predictions. The worksheets within...


