Curated OER
Factoring Trinomials
Students factor trinomials using specific factoring methods. In this algebra lesson, students factor equations using the difference of squares and foiling. They play a game to enhance their understanding of factoring.
Curated OER
Coloring Interval Graphs
Students investigate planning an activity and getting it done on time. In this algebra lesson, students define vocabulary words related quadratic equations, including the vertex and intervals. They figure a good way to color graphs...
Curated OER
A Geological Puzzle
Students compare and contrast the various types of rocks on each continent. In groups, the calculate the rock ages and types to determine if the continents, in their opinion, were joined at one time. They develop two imaginary...
Curated OER
Trigonometric Identities
Students calculate the six trigonometric identities. For this algebra lesson, students verify other identities using the basic trigonometric identities of sine, cosine and tangent. They complete a worksheet with hints and then are graded...
Curated OER
Lesson Plan On Fran Data
Seventh graders investigate the concept of functions and how they are used in the context of the real world while identifying the dependent and independent variables. They graph relations and functions and find the zeros of functions....
Curated OER
Tile Patterns that Grow
Students explore how a pattern built with square tiles grows and describe the change from stage to stage. They predict later stages of a tile design sequence and create math equations related to the growth of tile designs.
Curated OER
Proportions in Stories
Students solve problems dealing with ratios and proportions. In this algebra lesson, students rewrite word problems using equations and symbols. They correctly convert between percents and decimals.
Curated OER
Direct and Inverse Variation
Eighth graders participate in two data collection activities that involve direct and inverse variation. In the pre-assessment, 8th graders categorize numerical, graphical, and verbal representations as linear or nonlinear and determine...
Curated OER
Cell Phone Plans
Students relate the use of a cell phone to math. In this algebra lesson, students collect data on the usage of their phones and plot it. They analyze the graph and make predictions based on the rate per minute.
Virginia Department of Education
The Submarine
Submerge yourself in the study of slope. Scholars investigate a situation involving slope and the rate of change of a submarine. An additional example further explores the concept of slope by changing one of the conditions of the submarine.
EngageNY
Newton’s Law of Cooling, Revisited
Does Newton's Law of Cooling have anything to do with apples? Scholars apply Newton's Law of Cooling to solve problems in the 29th installment of a 35-part module. Now that they have knowledge of logarithms, they can determine the decay...
EngageNY
Modeling with Exponential Functions
These aren't models made of clay. Young mathematicians model given population data using exponential functions. They consider different models and choose the best one.
Curated OER
Purchasing A Used Car
Seventh graders investigate the practice of purchasing a used car with the help of links and resources found in the lesson plan. They conduct research to find the right kind of car using a variety of resources. Students examine data in...
Inside Mathematics
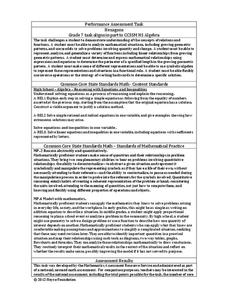
Hexagons
Scholars find a pattern from a geometric sequence and write the formula for extending it. The worksheet includes a table to complete plus four analysis questions. It concludes with instructional implications for the teacher.
Curated OER
Six Exponential Decay Problems
In this exponential model worksheet, students solve six exponential decay multiple choice questions and one free-response half life question. The solutions are provided..
Curated OER
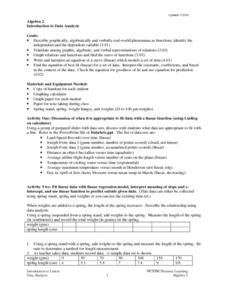
Introduction To Data Analysis
Seventh graders investigate the concept of looking at the data put in a variety of ways that could include graphs or data sets. They analyze data critically in order to formulate some sound conclusions based on real data. Students graph...
Curated OER
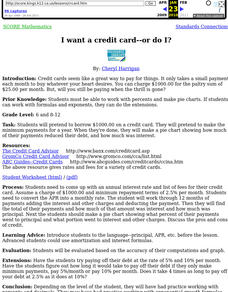
I want a credit card--or do I?
Students pretend to borrow $1000.00 on a credit card. They pretend to make the minimum payments for a year. When they're done, they make a pie chart showing how much of their payments reduced their debt, and how much was interest.
Virginia Department of Education
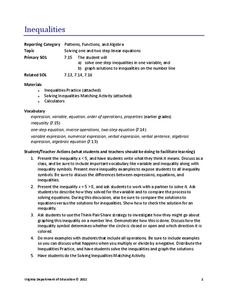
Inequalities
Not all resources are created equal — and your class benefits! Scholars learn how to solve one-step inequalities using inverse operations. They complete an activity matching inequalities to their solutions.
Curated OER
Weighted Averages
Weighted averages can be tricky to explain! However, this study guide makes it easy for teachers by including definitions, explanations, and breaking down problems into three steps. Includes mixture problems and uniform motion problems.
Noyce Foundation
Pizza Crusts
Enough stuffed crust to go around. Pupils calculate the area and perimeter of a variety of pizza shapes, including rectangular and circular. Individuals design rectangular pizzas with a given area to maximize the amount of crust and do...
Inside Mathematics
Population
Population density, it is not all that it is plotted to be. Pupils analyze a scatter plot of population versus area for some of the states in the US. The class members respond to eight questions about the graph, specific points and...
Noyce Foundation
Time to Get Clean
It's assessment time! Determine your young mathematicians' understanding of elapsed time with this brief, five-question quiz.
California Education Partners
Cady's Cats
How much can a cat eat? The five-question fraction assessment asks pupils to determine the fractional portion of a food box eaten by cats. Learners show their proficiency in adding and subtracting fractions using several scenarios...


