Schoolcraft College
Trigonometry
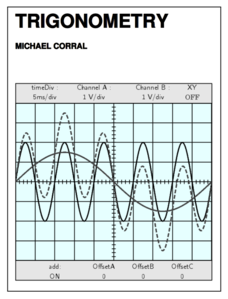
This trigonometry textbook takes the learner from a basic understanding of angles and triangles through the use of polar coordinates on the complex plane. Written by a mathematician-engineer, examples and problems here are used to...
Curated OER
Linear Inequalities in One and Two Variables: Rays and Half Planes
Define rays and half planes, including the concepts of boundary lines and prerequisite knowledge of coordinate planes. Given linear inequalities in one and two variables, your class will compare the differences. They will also graph...
Curated OER
The Tortoise And The Hare
Students use the children's story of The Tortoise And The Hare in order to investigate the graphing of equations. The story is converted to an algebraic word problem for them to solve. Students investigate the relationships of data and...
Curated OER
Representation of Quadratic Functions
Young scholars use a table, graph or equation to represent a quadratic function. In this algebra lesson, students model and graph with quadratic function. They become comfortable representing quadratics using different...
Curated OER
Interactivate - Lines, Rays, Line Segments, and Planes
Students explore lines, rays, line segments, and planes. In this math lesson, students discuss the math concepts and direct their instructor in graphing functions. Students collaborate in graphing additional functions.
Curated OER
Math Honors 2: Semester 1 Review
In this activity, learners review topics from Algebra 2. Topics include synthetic division, rational algebraic expressions, quadratic functions, imaginary number, composite functions, and inverse of a function. The three-page activity...
Curated OER
Linear Piecewise Functions
Students explore the concept of piecewise functions. In this piecewise functions lesson plan, students graph piecewise functions by hand and find the domain and range. Students make tables of values given a piecewise function. Students...
Curated OER
Using Parallel Axes To Discover Mathematical Interconnections
In this math worksheet, students graph the functions on parallel axes and observe the location of the slope point in relation to the x and y axes.
Curated OER
Let's Go Slopey
Students create a table of values to graph a line. In this algebra lesson, students identify the slope and intercept of a linear equation. They use a Ticalculator to graph their function.
Curated OER
Solutions, Solutions, Could it Be?
Students graph and solve linear system of equations. In this algebra lesson plan, students use algebraic and graphing methods to solve their systems. They find the point of intersection for their solution and draw inference from...
Curated OER
Saving the Bald Eagle
Students plot on a coordinate plane. In this algebra lesson, students identify points on a coordinate plane and graph lines given coordinate pairs. They create a model as they study bald eagles and their growth and decay.
Curated OER
Slope of a Line
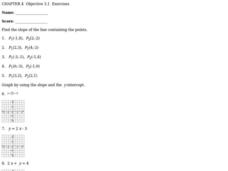
In this slope of a line worksheet, students solve ten problems determining the slope of points and an equation. First, they find the slope of the line containing the two points given in the first five problems. Then, students graph the...
Curated OER
Inequalities and Measures of Central Tendency
In this inequality and measures of central tendency worksheet, students solve and graph linear inequalities. They organize given data to identify the mean, mode and range. Students interpret box-and-whisker plots. This three-page...
Curated OER
Graphing Linear Equations - With Table
Students describe relations and graph linear functions. After studying a geometric shape and a verbal statement, students contrast the differences between the verbal statement and the picture. They determine functions and graph...
Curated OER
Linking Algebra to Temperature
Students convert between two units as they calculate the temperature. In this algebra lesson, students collect data on seasonal climate and create a graph. They make conjectures based on their data collection.
Curated OER
Function Investigation
In this functions activity, 11th graders solve and complete 18 different problems. First, they graph each equation on the graphs provided, making a rough sketch on a coordinate plane. Then, students predict what each graph will look like...
Curated OER
Coordinates and Equations
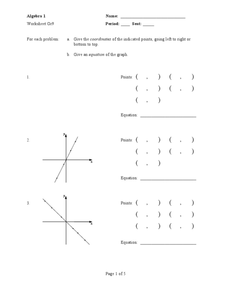
In this algebra worksheet, students solve linear equations and plot their results on the coordinate plane. There are 20 problems using slopes and intercepts to help graph linear equations.
Curated OER
Graphing Linear Equations
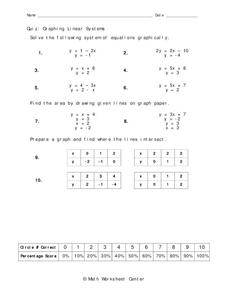
In this graphing worksheet, students solve systems of linear equations by graphing on a coordinate plane. Given specific coordinates, students determine the line of intersection. This one-page worksheet contains ten problems.
Curated OER
Conics and Graphing
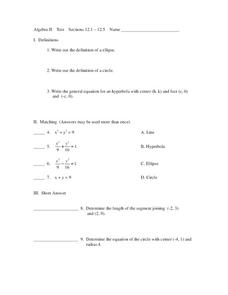
In this algebra worksheet, students solve equations by graphing an ellipse, circle and hyperbola. They match equations to graphs and define each type of function. There are 20 questions total.
Curated OER
Systems of Linear Inequalities
In this systems of linear inequalities learning exercise, 9th graders solve 10 different problems that include various linear inequalities. First, they solve each equation for y. Then, students graph each individual inequality and locate...
Curated OER
Straight Line Graphs
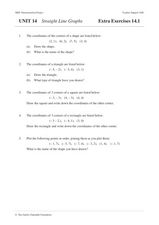
In this math worksheet, students plot lines on a graph paper when given the equation for the line in slope-intercept form. They tell the values of the slope and the y-intercept. Students find the x and y intercepts and plot three lines....
Curated OER
Algebra Exam
In this algebra worksheet, 11th graders graph, parabolas, absolute value and cubic functions. They factor polynomials and simplify roots. There are 75 questions.
Curated OER
Triangles Inscribed in a Circle
Are you tired of answers without understanding? Learners can give a correct response, but do they really understand the concept? Have young mathematicians think deeper about linear functions, angles, and formulas in algebra....
Georgia Department of Education
The Basketball Star
Have learners use math to prove they are sports stars! Assess a pupil's ability to create and analyze data using a variety of graphs. The class will be motivated by the association of math and basketball data.


