Curated OER
Translating Graphs of Trig Functions
Students use degrees and compute the amplitude and period of twelve functions. They graph each function on an included coordinate grid.
Curated OER
Solving Systems of Equations by Graphing
In this systems of linear equations worksheet, students graph two equations on each coordinate grid. All systems are linear. One of the systems is parallel. The others have one point of intersection.
Curated OER
Graphing Systems of Equations
In this Algebra II worksheet, 11th graders use graphing to determine the solution to a system of linear equations. The two page worksheet contains explanation and three guided problems. Answers are not included.
Curated OER
Graphing Linear Equations
Students graph linear equations. In this algebra lesson plan, students solve linear equations and graph it on a coordinate plane. They evaluate integers using linear equations.
Curated OER
Family Letter and Algebra
In this algebra worksheet, students receive a parent informational letter. The letter discusses what will be covered in algebra that school year and has an ordering integers activity.
Curated OER
Rational Function Graphs
Students use algebraic methods to represent and solve problems. Using a graphing calculator, students solve rational and inequality problems. They visually demonstrate solutions of functions through graphing. Students answer questions...
EngageNY
Analyzing Residuals (Part 1)
Just how far off is the least squares line? Using a graphing calculator, individuals or pairs create residual plots in order to determine how well a best fit line models data. Three examples walk through the calculator procedure of...
EngageNY
Federal Income Tax
Introduce your class to the federal tax system through an algebraic lens. This resource asks pupils to examine the variable structure of the tax system based on income. Young accountants use equations, expressions, and inequalities to...
Balanced Assessment
Getting Closer
Flip the script! Reverse the situation and ask the class to find the function given asymptotes. The task requires class members to use their knowledge of functions and asymptotes to create functions that have a given asymptote or...
EngageNY
Ferris Wheels—Tracking the Height of a Passenger Car
Watch your pupils go round and round as they explore periodic behavior. Learners graph the height of a Ferris wheel over time. They repeat the process with Ferris wheels of different diameters.
Virginia Department of Education
How Much is that Tune?
Tune in for savings! Scholars investigate pricing schemes for two different online music download sites. After comparing the two, they determine the numbers of songs for which each site would be cheaper.
Curated OER
Slopes and Linear Equations
Young scholars find the slopes of linear functions. In this graphing instructional activity, students analyze linear equations and calculate the slope of the line. They graph a line given the slope and y-intercept.
Curated OER
When Am I Ever Going to Use this?
Young scholars solve problems using equations and properties of integers. In this algebra lesson, students solve problems using ratio and proportion and graph their answers on a coordinate plane. They solve word problems using geometry.
Curated OER
Functions and Their Graphs
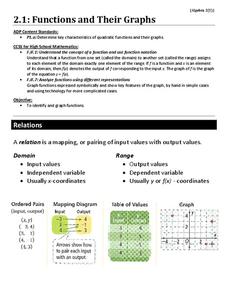
Use a instructional activity to go over the basic concepts of relations and functions. Included are clear definitions and examples of relations, domain and range, and functions and the vertical line test. However, the problems are...
Curated OER
Linear and Exponential Functions
This comprehensive unit on linear and exponential functions provides numerous clearly-written worksheets. Topics include graphing linear equations, solving systems of equations algebraically and by graphing, identifying the domain and...
Mathematics Assessment Project
Sorting Equations of Circles 2
How much can you tell about a circle from its equation? This detailed lesson plan focuses on connecting equations and graphs of circles. Learners use equations to identify x- and y-intercepts, centers, and radii of circles. They also...
Curated OER
Parabolas
In this algebra worksheet, learners solve parabolas using the standard and vertex forms. They find the vertex and asymptote and graph the parabola. There are 64 problems.
Curated OER
Properties of Parabolas
In this properties of parabolas worksheet, students identify the vertex and the minimum and maximum value of each parabola. They graph parabolas on a coordinate plane. This four-page worksheet contains 14 problems. Answers are provided...
Curated OER
Academic Algebra II - 1st Semester Exam
In this solving quadratic equations worksheet, students solve 60 multiple choice and short answer problems. Students complete the square, factor, multiply, and solve quadratic equations.
Curated OER
A Wet Welcome Home
Students investigate data collection and analysis. In this Algebra I lesson plan, students create a scatter plot and find the equation of best fit in a simulation of a leaking water pipe.
Curated OER
Points of Intersection
Eighth and ninth graders solve five different problems that include solving two equations. They determine the point of intersection in each of the five pairs of equations given. Pupils define point of intersection as the point where two...
Curated OER
Decode Word Is..
Students solve problems using patterns. In this algebra activity, students identify the relation, domain and range of a function. They graph functions using coordinate pairs.
Natinal Math + Science Initative
Slope Investigation
Context is the key to understanding slope. A real-world application of slope uses a weight loss scenario with a constant rate of change to introduce the concept of slope of a line, before it makes a connection to the ordered pairs and...
Curated OER
Round and Round and Round We Go!
Students investigate motion using a CBL. In this algebra instructional activity, students collect and graph data on a coordinate plane. They define and identify amplitude and period of conic graphs.


