Illustrative Mathematics
Equations of Lines
The intent of this resource is to show algebra learners that there is a proportional relationship between two lines that have an intersecting point. As the coordinate x increases by a constant, the y coordinate also increases. It...
Virginia Department of Education
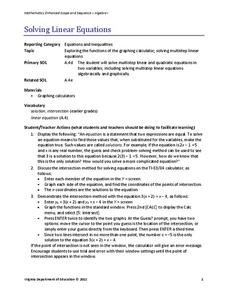
Solving Linear Equations
Practice solving linear equations by graphing. Scholars learn to solve multi-step linear equations in one variable by graphing both sides of the equation separately. They use graphing calculators to find the intersection of the graphs.
Illustrative Mathematics
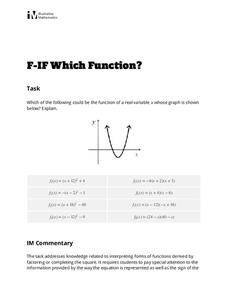
Which Function?
Learners are given a graph of a parabola on a coordinate system, but intercepts and vertex are not labeled. The task is to analyze eight given quadratic functions and determine which ones might possibly be represented by the graph. The...
Curated OER
Who Shares My Function?
Students differentiate between linear and quadratic functions. In this algebra instructional activity, students write equations of graphs and graph a function from an equation. They also move the graph around on the coordinate...
Curated OER
Functions
In this algebra worksheet, students look at 4 sets of relations and determine if they are functions. Students are provided with the graphs of three functions and determine the function value. Two relations are graphed on the coordinate...
Curated OER
Investigation - Looking For Triangles
Seventh graders investigate a series of triangles, looking for patterns and generalizing what they have found. They analyze the pattern data and organize it into a table and graph. Students identify the relationship and discover the rule...
Curated OER
Hyperbolas
Young scholars engage in a lesson that covers the concepts related to the graphing of hyperbolas looking at topics like foci, center, vertices, and asymptotes. They find multiple different points in the coordinate plain and then plot the...
Curated OER
Discovering Ohm's Law
Connect math with science! Pupils apply properties of Ohms Law as they solve problems and identify the inverse relationship of a function. They analyze the shape of the graph of an inverse function and use it to make predictions.
Curated OER
Parabolas
Students find equations of parabolas in real world scenarios. In this finding equations of parabolas in real world scenarios lesson, students find the equations of parabolas of US landmarks. Students put a grid on landmarks...
Curated OER
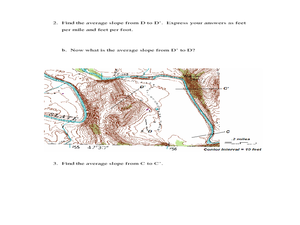
Slope and Topographic Maps
Students investigate slopes as they study topographic maps. In this algebra activity, students discuss and apply the concept of slopes to graphing and analyzing data.
Center of Excellence for Science and Mathematics Education
A Sick Astronaut
Aspiring astronauts graph, interpret, and analyze data. They investigate the relationship between two variables in a problem situation. Using both graphic and symbolic representations they will grasp the concept of line of best fit to...
Curated OER
The Price Is Right
Students create a list of products with estimated prices. In this algebra lesson, students learn to write equations using variables. They match their created list with that of actual products and compare their prices,
Curated OER
Relating Distance and Velocity Over Time
Students calculate the distance and velocity over time. In this algebra instructional activity, students graph a linear function to represent the distance vers time travel. They interpret their graphs and draw conclusion.
Curated OER
Introductory Algebra Chapter 8 Review
In this math worksheet, students solve the problems that are correlated with the objectives. Each practice set has an in depth example.
Inside Mathematics
Functions
A function is like a machine that has an input and an output. Challenge scholars to look at the eight given points and determine the two functions that would fit four of the points each — one is linear and the other non-linear. The...
EngageNY
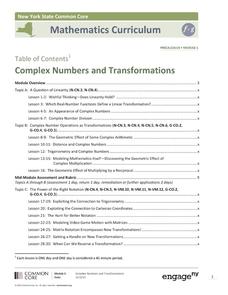
Complex Numbers and Transformations
Your learners combine their knowledge of real and imaginary numbers and matrices in an activity containing thirty lessons, two assessments (mid-module and end module), and their corresponding rubrics. Centered on complex numbers and...
Curriculum Corner
8th Grade Math "I Can" Statement Posters
Clarify the Common Core standards for your eighth grade mathematicians with this series of classroom displays. By rewriting each standard as an achievable "I can" statement, these posters give students clear goals to work toward...
Curated OER
Inquiry Unit: Modeling Maximums and Minimums
Young mathematicians explore the maximun area for patio with the added complexity of finding the mimimum cost for construction. First, they maximize the area of a yard given a limited amount of fence and plot width v. area on a...
EngageNY
Finding Systems of Inequalities That Describe Triangular and Rectangular Regions
How do you build a polygon from an inequality? An engaging lesson challenges pupils to do just that. Building from the previous lesson in this series, learners write systems of inequalities to model rectangles, triangles, and even...
Inside Mathematics
Picking Apples
Getting the best pick of the apples depends on where to pick. The short assessment presents a situation in which class members must analyze a real-world situation to determine the cost of picking apples. The pricing structures resemble...
Houghton Mifflin Harcourt
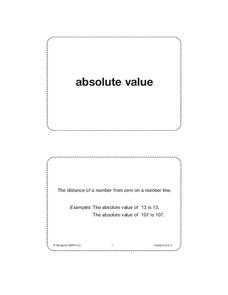
Unit 4 Math Vocabulary Cards (Grade 6)
Reinforce math vocabulary with a set of flash cards. Forty-eight cards offer boldly printed words, and their corresponding definition alongside an example with labels. Terms include absolute value, inverse operations, slope, and more!
Curriculum Corner
7th Grade Math Common Core Checklist
With so many math standards to fit into a school year, it can be difficult keeping track of what you have and have not covered. This collection of Common Core checklists allows you to maintain a running record of when each...
Curriculum Corner
8th Grade Math Common Core Checklist
Ensure your eighth graders get the most out of their math education with this series of Common Core checklists. Rewriting each standard as an "I can" statement, this resource helps teachers keep a record of when each standard was...
EngageNY
Mid-Module Assessment Task: Grade 7 Mathematics Module 4
Assess the ability of the class to solve percent problems with an assessment that covers a variety of percent problems from basic to multi-step. Pupils make connections between percent problems and proportional thinking to complete...


