Curated OER
Algebra II Calculator Lab
In this quadratic functions learning exercise, learners use their graphing calculators to solve the 9 problems on the page. The questions ask students to graph functions, compare graphs, find the vertex and axis of symmetry and more.
Curated OER
Graphing Linear Equations
In this graphing worksheet, students graph ten linear equations on each of the graphs provided. They first plug in some values to the given equation using a T-chart. This will give them their coordinates to use on the graph and form...
Curated OER
Graphing Inequalities
In this inequality worksheet, students solve inequalities on a coordinate plane by graphing. The linear equations contain two variables. This one-page worksheet contains ten problems.
Curated OER
Graph Paper
Students are given pre-made graph paper. In this algebra instructional activity, students are given copies of graph paper that can be used to plot points on a coordinate plane already measured out.
Curated OER
Definition of a Function
Get those kids to solve and graph 10 different problems that include various types of functions and their relations. They determine if each graph represented is the relation of a function then determine which value of the variable will...
Noyce Foundation
Granny’s Balloon Trip
Take flight with a fun activity focused on graphing data on a coordinate plane. As learners study the data for Granny's hot-air balloon trip, including the time of day and the distance of the balloon from the ground, they practice...
Curated OER
Describing Data
Your learners will practice many ways of describing data using coordinate algebra in this unit written to address many Common Core State Standards. Simple examples of different ways to organize data are shared and then practice problems...
Concord Consortium
Function Project
What if a coordinate plane becomes a slope-intercept plane? What does the graph of a linear function look like? Learners explore these questions by graphing the y-intercept of a linear equation as a function of its slope. The result is a...
EngageNY
Searching a Region in the Plane
Programming a robot is a mathematical task! The activity asks learners to examine the process of programming a robot to vacuum a room. They use a coordinate plane to model the room, write equations to represent movement, determine the...
Fall River Schools
Parabolas Are All Around Us
Moving parabolas off of graph paper and into the real world is the task at hand in this detailed poster project. First, learners perform a cumulative activity identifying many characteristics of an assigned quadratic equation. Next, they...
BW Walch
Solving Systems of Linear Inequalities
One thing that puzzles a lot of young algebrists is the factors in a word problem that are taken as "understood". This presentation on solving systems of linear inequalities does a great job walking the learner through how to tease those...
Curated OER
Expressing Geometric Properties with Equations
Algebra and geometry are not interchangeable. Demonstrate why not with a series of problems that deal with the equations of circles and equations of lines that meet specific criteria.
Curated OER
Reading Graphs
Pupils plot functions on the Cartesian coordinate plane. They explore lines and parabolas. Students analyze graphs and answer questions about the information presented on the graph using an online program.
Curated OER
Reading Graphs
Students practice plotting functions on the Cartesian coordinate plane, see several categories of functions, including lines and parabolas, and read a graph, answering questions about the situation described by the graph
Curated OER
Variables and Patterns: Determining an appropriate scale while graphing
Sixth graders determine appropriate scales when graphing data. In this graphing lesson, 6th graders use an the applet "Graph It" to determine what is an appropriate scale for their data.
Curated OER
Cartesian Coordinate System
Students explore the concept of the coordinate plane. In this coordinate plane lesson, students graph points on the coordinate plane using an applet. Students graph functions using an applet. Students play a Maze Game where they must...
Curated OER
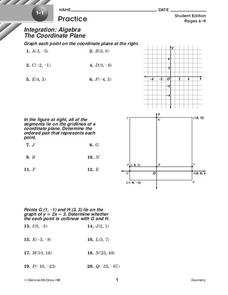
The Coordinate Plane
In this coordinate plane learning exercise, 10th graders solve 20 various types of problems all related to identifying point on a coordinate plane. First, they graph each point on the coordinate plane at the top. Then, students determine...
Curated OER
Chapter 5 - Objective 1.1 Graphing Ordered Pairs
In this ordered pairs instructional activity, students graph given ordered pairs on a coordinate plane. This one-page instructional activity contains three graphing problems.
Curated OER
The Coordinate Plane
Students engage in a lesson plan that is about the concept of graphing using the coordinate plane. They view a PowerPoint presentation and practice solving different problems. Students discuss vocabulary words with the help of the...
Curated OER
Algebra: Co-ordinates
Students use Cartesian coordinates. In this graphing instructional activity students use simple formulae, interpret coordinates, and create graphical representations. They express their work algebraically.
Curated OER
Equations of Graphs
In this equations of graphs learning exercise, 9th graders solve and graph 10 different problems that include various types of graphs. First, they determine the equation for each graph shown at the top of the sheet. Then, students...
Curated OER
Graphing Linear Equations with Calculator
Young scholars graph lines using the calculator. In this algebra lesson, students graph lines of equations in the form y=mx+b. They input equations into the TI Calculator and graph using the slope and intercept. They analyze the graph...
Curated OER
Graphing Linear Equations
Ninth graders review the information that they have already learned
with regard to linear equations and graphical representations. They then assist in combining equations with a graphical element and complete various graphs with this...
Curated OER
Linear Graphs and Equations 5.1
In these identifying coordinates on a grid, linear graphs, and equations worksheets, 6th graders draw the shapes and letter, complete a table and use it to draw a graph, calculate gradients of lines, determine equations of lines, solve...


