Curated OER
Chapter 10 - Objective 6.1 Graph
In this graphing worksheet, students solve linear and parabolic equations and graph equations on a coordinate plane. They use the discriminant to determine the number of x-intercepts of a parabola. This one-page worksheet contains ten...
Curated OER
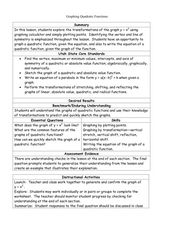
Graphing Quadratic Functions
In this math worksheet, students write 8 equations of the axis of symmetry and find the coordinates of each quadratic function. Students graph 4 of the equations and state if the vertex is maximum or minimum.
Curated OER
Cartesian Coordinates
Students investigate rational numbers through data analysis and statistics. For this algebra lesson, students represent, rename, compare and order rational numbers. They collect and represent data correctly on a graph.
Curated OER
Integrated Algebra/Math A Regents Questions: Systems of Linear Inequalities
In this systems of inequalities worksheet, students solve 6 multiple choice questions. Students determine if a given point is a solution to the system of inequalities given a graph or inequality.
Curated OER
Graphing lines in Standard Form
In this algebra worksheet, students graph lines on a coordinate plane after rewriting the equations in the form y= mx + b. There are 12 graphing problems with an answer key.
Curated OER
Algebra 2 - Linear Programming
Learners read real world problems, determine the variables, and set up the function using algebraic statements. After entering data into the graphing calculator, they display information in the form of graphs and scatter plots. ...
Curated OER
Generating Points and Graphing
Students create a table of values to help them plot. In this algebra instructional activity, students plot their points on a coordinate plane creating a graph. They observe and analyze linear functions.
Curated OER
Slopes of Lines
For this slopes of lines worksheet, 10th graders solve and graph 10 different problems. First, they determine the slope of each line named in the figure and any line parallel to line b and perpendicular to line d. Then, students graph...
Curated OER
Graphing Linear Inequalities
In this linear inequality worksheet, students graph given equations on a coordinate plane. Afterward, they shade in the graph to identify the solution set. This one-page worksheet contains ten problems.
EngageNY
Four Interesting Transformations of Functions (Part 1)
Understanding how functions transform is a key concept in mathematics. This introductory lesson makes a strong connection between the function, table, and graph when exploring transformations. While the resource uses absolute value...
Curated OER
Matrix Madness!!
Perform operations to add, subtract, multiply and divide matrices. Then solve problems with vectors using matrices. A three day lesson plan: Matrix Madness, Mystical Matrices, and Decode the Encode. The last lesson plan has prizes that...
Curated OER
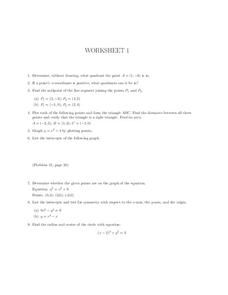
Worksheet 1, Coordinate Graphing
In this algebra worksheet, pupils determine the quadrant a given point is in. They find the midpoints of two line segments. Students plot points to form a triangle and find the distance between points. Pupils find the area of the...
Curated OER
A Sum of Functions
Collaborative learners will see the geometric addition of functions by graphing the sum of two graphed curves on the same coordinate plane. This task then naturally flows into giving learners the algebraic representation of the curves...
Curated OER
Lines, Lines, Everywhere
Students explore linear equation suing real life scenarios. In this algebra lesson, students find the slope and intercept of a line. They create table of values to plot their graph and draw conclusions.
Curated OER
Graphing Linear Equations Using the Table Method
Learners graph linear equations using a table. In this algebra lesson, students create a table of values using the linear equation to find the y-values. They plot their point on a coordinate plane and graph the line.
Curated OER
Algebra 1
Young scholars study the functional relationships of a variety of problems. In this functional relationship lesson, students determine the dependent and independent quantities of a given set of data. Young scholars record the...
Curated OER
Algebra/Geometry Institute Summer 2007: Graphing Activity
Seventh graders practice identifying coordinates by examining a city map. In this graphing lesson plan, 7th graders create coordinate directions on an index card and practice locating these locations on a grid. Students read...
Curated OER
Proportionality in Tables, Graphs, and Equations
Learners create different methods to analyze their data. In this algebra lesson, students differentiate between proportion and non-proportional graph. They use the TI-Navigator to create the graphs and move them around to make their...
Curated OER
Polar Coordinates Game
In this algebra game, students pair off to plot polar coordinates on a circular graph. They attempt to hit each other by guessing their opponents location on the graph. This is a great way to reinforce the concept of polar coordinates....
Curated OER
Investigating Linear Equations Using Graphing Calculator
Learners investigate linear equations using the Ti-Calculator. In this algebra lesson, students graph lines and identify the different quadrants on a coordinate plane. They identify ordered pairs used to plot lines.
Curated OER
Graphing Inequalities and Shading
Students graph and shade inequalities. In this algebra instructional activity, students graph inequalities using the slope-intercept form. They shade the side of the line that is the solution and identify the domain and range.
Curated OER
Graphing Parabolas and Circles
Students graph parabolas and circles. In this algebra lesson, students create a table of values and graph the coordinate pairs to create a graph. They graph a circle using the radius and center.
Curated OER
Functions and the Vertical Line Test
Students examine functions and function notation. They use computer activities to discover how to graph functions, and conduct a vertical line test. Students describe spatial relationships using coordinate geometry.
Curated OER
Inverse Functions
In this inverse functions worksheet, 9th graders solve and graph 10 different problems that include the inverse of various functions. First, they determine if the coordinates given is the inverse of a function given. Then, students use...


