Curated OER
A Penny Saved is a Penny Earned
Students explore the concept of exponential growth. In this exponential growth lesson, students manipulate power models with base 2. Students discuss what would happen if you doubled a penny over the course of 20 days. ...
Curated OER
Let's Gather Around the Circle
Scholars explore the relationship between circumference and diameter. Groups of learners measure the diameter and circumference of round objects and record their data on a given worksheet. They then input the data into their graphing...
Curated OER
Name That Tune: Matching Musical Tones Through Waveform Analysis
Pupils detect the waveform of musical notes to determine the code for the "safe" in this forensics simulation lesson. They use a microphone and tuning forks along with Vernier EasyData on their graphing calculator to analyze five musical...
Curated OER
Tech Algebra: A Statistics Study
Students use the internet to gather a minimum of thirty pieces of data. Students create box and whisker graphs, and stem and leaf plots from the information. They calculate mean, median, mode, and range. Students write a summary and...
Curated OER
Algebra 1
Students study the functional relationships of a variety of problems. In this functional relationship lesson, students determine the dependent and independent quantities of a given set of data. Students record the data and...
Curated OER
Applications Of Rational Functions
Students engage in a instructional activity that is about relational functions with the application of methods to real life problem situations. They use the examples found in the instructional activity for the purpose of practice during...
Curated OER
Square Roots, Number Classification, Ordering & Graphing
Ninth graders identify numbers as rational or irrational. Using calculators estimation, and factoring methods, 9th graders compute the square root of numbers. They graph numbers in sequential order and round numbers integers to the...
Curated OER
Matrix Operations
Students solve problems using matrices. In this algebra lesson, students add, subtract and multiply matrices. They use the graphing calculator to simplify and graph linear equations.
Curated OER
Graphing Linear Equations
Students graph linear equations. In this algebra lesson, students investigate the price of tolls in different states and create a graph. They analyze their graph and draw conclusions.
Curated OER
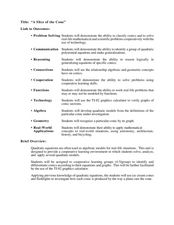
"A Slice of the Cone"
Here is a set of lessons that explore conics in a number of different ways. Starting with modeling how a conic is produced by the way a plane cuts the cone, to solving complex word problems, algebra learners progress through a series of...
EngageNY
Distributions—Center, Shape, and Spread
Data starts to tell a story when it takes shape. Learners describe skewed and symmetric data. They then use the graphs to estimate mean and standard deviation.
EngageNY
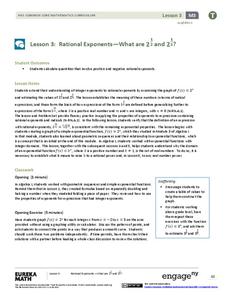
Rational Exponents—What are 2^1/2 and 2^1/3?
Are you rooting for your high schoolers to learn about rational exponents? In the third installment of a 35-part module, pupils first learn the meaning of 2^(1/n) by estimating values on the graph of y = 2^x and by using algebraic...
EngageNY
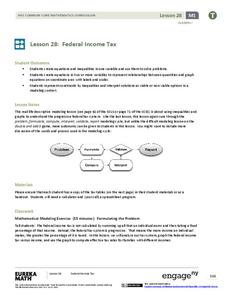
Federal Income Tax
Introduce your class to the federal tax system through an algebraic lens. This resource asks pupils to examine the variable structure of the tax system based on income. Young accountants use equations, expressions, and inequalities to...
EngageNY
Modeling a Context from a Verbal Description (part 2)
I got a different answer, are they both correct? While working through modeling problems interpreting graphs, the question of precision is brought into the discussion. Problems are presented in which a precise answer is needed and...
EngageNY
Building Logarithmic Tables
Thank goodness we have calculators to compute logarithms. Pupils use calculators to create logarithmic tables to estimate values and use these tables to discover patterns (properties). The second half of the lesson has scholars use given...
Curated OER
Matrix Madness!!
Perform operations to add, subtract, multiply and divide matrices. Then solve problems with vectors using matrices. A three day lesson: Matrix Madness, Mystical Matrices, and Decode the Encode. The last lesson has prizes that the class...
National Security Agency
Partying with Proportions and Percents
Examine ratios and proportions in several real-world scenarios. Children will calculate unit rates, work with proportions and percentages as they plan a party, purchase produce, and take a tally. This lesson plan recommends five...
EngageNY
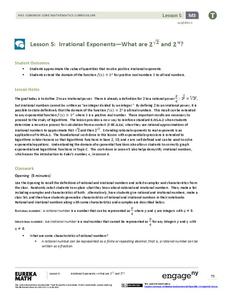
Irrational Exponents—What are 2^√2 and 2^π?
Extend the concept of exponents to irrational numbers. In the fifth installment of a 35-part module, individuals use calculators and rational exponents to estimate the values of 2^(sqrt(2)) and 2^(pi). The final goal is to show that the...
Texas Instruments
Making Predictions Using Systems of Equations
Students explore the concept of systems of equations. In this system of equations instructional activity, students enter data into lists on their calculators about 100 meter dash times. Students plot the points using a scatter plot and...
Curated OER
Simple Inequalities on a Number Line
Students solve inequalities problems. In this algebra lesson, students graph the solution of inequalities on a number line. They discuss boundaries and open or closed intervals.
Curated OER
Introduction to Tangent Lines using the TI-Nspire
Students make mathematical argument using the concept of Limit. In this algebra lesson, student calculate the instantaneous rate of change from the linear graph. They use a TI-calculator to create a visual of the graphs.
Curated OER
Linear and Exponential Models
Students linearize data to determine if an exponential model is suitable. In this linearizing data to determine if an exponential model is suitable lesson plan, students graph the residuals of sets of data that appear to have an...
Curated OER
Oodles of Poodles
Students solve equations by graphing. In this algebra lesson, students differentiate between functions and relations. They use the TI to graph their equation and analyze the graph.
Curated OER
Domain and Range 2
How do you identify the domain and range of the function? As learners find out it's as easy as creating a graph. They'll identify the domain and range of a relation from its graph, write symbolic expressions describing the relationship...


