Curated OER
Maximizing Your Efforts
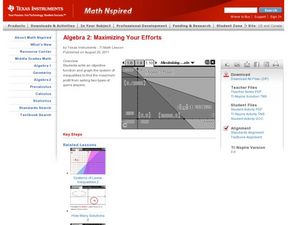
Young scholars graph systems of equation. In this algebra lesson, students find where the lines cross and identify the type of solution. They analyze a graph and write the equation of the line.
Curated OER
Multiplying Monomials
Learners differentiate between linear and quadratic functions. In this algebra instructional activity, students write equations of graphs and graph a function from an equation. They also identify the slope and y-intercept.
Curated OER
Derivative Grapher
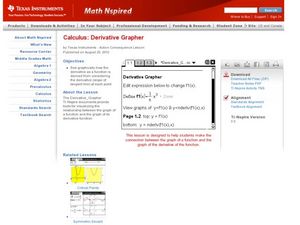
Learners graph the derivative of functions in this calculus lesson. They use the TI to graph their functions and algebraically take the derivative of each function. They then create a visual and analyze the graph.
Curated OER
Domain and Range of Exponential Functions
Have your class find the domain and range for each function. Students graph equations using the TI. They find all the x and y values as they relate to the domain and range.
Curated OER
Get Your Numbers in Shape - TI-83
High Schoolers use the TI-83 calculator to produce a sequence, explore patterns and find a linear or quadratic equation for a given pattern. They use inductive reasoning to make conjectures about patterns. They find the Y-value of a...
Curated OER
Slopes and Linear Equations
Students find the slopes of linear functions. In this graphing lesson, students analyze linear equations and calculate the slope of the line. They graph a line given the slope and y-intercept.
Curated OER
Domain and Range
Your class will grasp the concept of domain-and range on a graph by using their TI navigator to graph their lines. They observe the effect of a function and non-functions based on the domain and range.
Curated OER
Linear Inequalities - Parallelogram Problem
Students use the Geometer's Sketchpad to illustrate possible answers to a parallelogram problem. As a class, they discuss the point-slope and linear equation forms. Individually, students solve their equations and check the results on...
Curated OER
Collecting And Fitting Quadratic Data
Learners investigate the concept of using quadratic data to plot coordinates on a plane. They also apply the quadratic formula for a variety of problems with the help of a graphing calculator to draw the parabola for given coordinates.
Curated OER
Round and Round and Round We Go!
Students investigate motion using a CBL. For this algebra lesson, students collect and graph data on a coordinate plane. They define and identify amplitude and period of conic graphs.
Curated OER
Regressive Music
Student use the Ti calculator to graph sinusoidal graphs. In this calculus activity, students use the CBL to collect and analyze data of sinusoidal graphs. They manipulate their collected data and make predictions.
Curated OER
The Kangaroo Conundrum: A Study of a Quadratic Function
Students play a game and collect data for their graph. In this algebra lesson, students solve quadratic equations and identify properties of their graph. They describe the pattern created by the graph and the game.
Curated OER
Decode Word Is..
Students solve problems using patterns. In this algebra lesson plan, students identify the relation, domain and range of a function. They graph functions using coordinate pairs.
Curated OER
Plugging Into The Best Price
Examine data and graph solutions on a coordinate plane with this algebra lesson. Young problem-solvers identify the effect of the slope on the steepness of the line. They use the TI to graph and analyze linear equations.
Curated OER
Exploring Exponential Growth and Decay Functions
Students differentiate between exponential growth and decay. In this algebra instructional activity, students solve exponential equations using properties of exponents. They use the Ti calculator to graph and analyze their...
Curated OER
Discovering Different Types of Functions
Graph polynomials and identify the end behavior of each polynomial function. The class differentiates between linear, quadratic, and other polynomial equations.
Texas Instruments
Is It or Isn't It Proportional
How can you tell if number relationships are proportional? Mathematicians investigate proportional relationships. They compare and contrast functions and graphs to determine the characteristics of proportional relationships, as well as...
Curated OER
Sums and Difference of Cubes
Learners factor polynomials using the sum and difference of cubes. They also learn connections between the graph and expression.
Curated OER
One of the Many Ways
Explore the concept of polynomials and determine the value and number of zeros for a given polynomial using the Rational Root Theorem. Then graph the polynomials and relate the number of zeroes to the degree of the polynomial.
University of Georgia
Endothermic and Exothermic Reactions
Equip your chemistry class with the tools to properly understand endothermic and exothermic reactions. Young chemists collect, analyze, and graph data to determine how the Law of Conservation of Matter is applied to chemical...
Curated OER
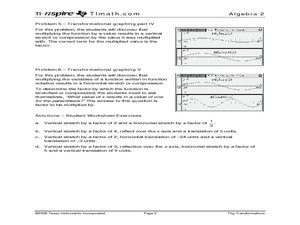
Trig Transformations
Learners investigate trigonometric function. In this Algebra II lesson, students explore functional notation and transformational graphing of trigonometric functions.
Alabama Learning Exchange
Finding Prime
Fifth and sixth graders explore prime numbers. They work with a partner to build rectangular arrays using twelve tiles. Factor pairs are noted and recorded on graph paper. Pupils construct rectangular arrays with a prime number and...
Curated OER
How Many Solutions to the System?
Solve systems of equation using graphing! In this algebra lesson, students use the TI to graph two lines and identify the number of solutions. They perform interactive graphing on the navigator.
Curated OER
Guess the Ages
Learners explore scatter plots in this algebra lesson. They create a scatter plot from their guesses regarding a famous person’s birth date and the actual birth date then they examine and interpret the results of their graph.


