Curated OER
The Fuelish Fact Finding
Students define fluctuation and the price of food. In this algebra lesson, students create a budget to live on based on their living expenses. They create a chart and explore the cause and effect of real life scenarios.
Curated OER
Linear Functions
Students solve and graph linear equations. In this algebra activity, students collect data and plot it to create a linear function. They identify the domain and range of each line.
Curated OER
How Do They Relate? Linear Relationship
Students collect information and use a line to represent it. In this algebra lesson, students investigate real world data to see if it makes a line. They graph the line comparing the relationship of the x axis with that of the...
Curated OER
Exponential and Exponents Functions
Students solve problems using exponential properties. In this algebra instructional activity, students differentiate between exponents, exponential and log functions. They graph their functions using table and exponents.
Curated OER
Modeling Population Growth
Students collect data on population growth. In this statistics lesson, students graph their data and make predictions. They find the linear regression and the best fit line.
Virginia Department of Education
Functions 2
Demonstrate linear and quadratic functions through contextual modeling. Young mathematicians explore both types of functions by analyzing their key features. They then relate these key features to the contextual relationship the function...
Virginia Department of Education
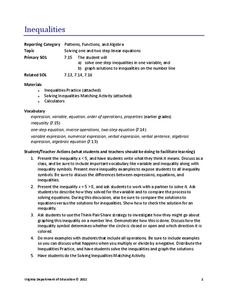
Inequalities
Not all resources are created equal — and your class benefits! Scholars learn how to solve one-step inequalities using inverse operations. They complete an activity matching inequalities to their solutions.
Virginia Department of Education
Curve of Best Fit
Which function models the data best? Pupils work through several activities to model data with a variety of functions. Individuals begin by reviewing the shapes of the functions and finding functions that will fit plotted data points. By...
Virginia Department of Education
Spring Fling Carnival
Think critically — and linearly by applying linear equations to solve real-world problems. Young mathematicians write equations to model the profit on popcorn and cotton candy at a carnival and solve problems using these equations.
Curated OER
Voter Turnout
High schoolers solve problems using math. They complete a graph, using data from the 2000 presidential election results. Students predict and calculate the outcome of the election based upon the voting patterns.
Curated OER
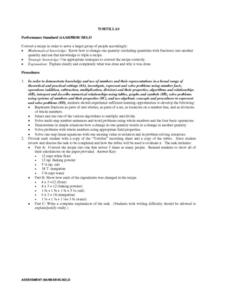
Tortillas
Students convert recipes for tortillas. They calculate the amounts of ingredients as they convert recipes and write an explanation of the task to demonstrate their calculations. After reviewing their calculations, they demonstrate how...
Curated OER
The Graduation Dilemma
Ninth graders explore data analysis. In this Algebra I lesson, 9th graders collect and organize data to create a scatter plot. Students use the regression feature of the calculator to find the line of best fit and use the...
Texas Instruments
Buying Your First New Car!
Learners explore exponential growth and decay using M&M’s in this Algebra II/Pre-calculus lesson. They investigate the cost of a new car by calculating depreciation and payments.
Curated OER
Functions and Inverses
Students solve problems identifying the functions and inverses. In this algebra instructional activity, students identify a one-to-one function, and perform the horizontal line test. They analyze data and graph their results on a...
Curated OER
Standard Form of Equations
Learners complete the square and identify different parts of a quadratic equation. In this algebra lesson, pupils graph conics using the TI calculator. They rewrite equations by completing the square.
Curated OER
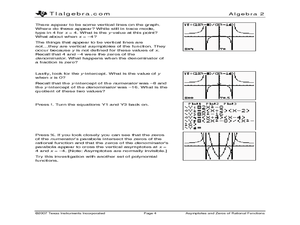
Asymptotes and Zeros
Learn how to explore rational functions and investigate the graphs rational functions and identify its singularities and asymptotes. Students approximate the solutions to rational equations and inequalities by graphing.
Curated OER
TI-Nspire Activity: What Does Your Representation Tell You?
By learning to select the best representation for three meal plans, students compare three meal plans to determine the best choice. Data for the meal plans is sorted on a table, as an algebraic equation, and graphed on a coordinate grid....
Curated OER
Wrapping It All Up
Through learning how to examine linear, quadratic, and exponential functions, young scholars explore the effects of changes in parameters on the graphs of linear, quadratic, and exponential functions. The lesson plan is designed to...
Curated OER
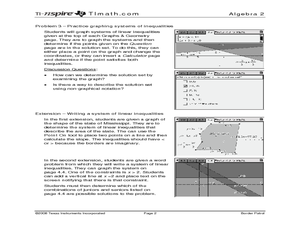
Border Patrol ID: 11603
Incorporate technology in your classroom by teaching your learners how to graph systems of linear inequalities as they apply to an area of land. The lesson plan provides an extension in which students are challenged to write a...
Curated OER
Exponential Functions f(x) = abx
Students define exponential functions and graph the equation. For this algebra lesson, students discuss exponential growth and decay as they graph their functions. They differentiate between the base of growth and decay.
Curated OER
Families of Functions
Learners use sliders to change the parameters of functions and examine how shifting parameters affects a graph. They identify the parameters of functions, find vertical and horizontal stretches, then calculate the scale factor and other...
Curated OER
Systems of Linear Inequalities
The class solves systems of linear inequalities. They graph lines and identify the point of intersection.They graph lines and identify the boundary that represent the solution and solution set.
Curated OER
Rate of Change
Students observe and calculate slopes. In this algebra lesson plan, students graph equations and determine the pace at which the slope is changing. They use the navigator to see the change as they graph the lines around.
Curated OER
Multiple Representations
Every topic or subject has its own special jargon. Learners work on their math vocabulary as it relates to basic algebra terms. They define and identify function, functional notation, ordered pairs, rate of change, slope,...


