Curated OER
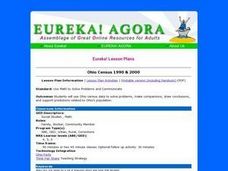
Ohio Census 1990 & 2000
Students use Ohio census data to solve problems, make comparisons, draw conclusions, and support predictions related to Ohio's population. They interpret and work with pictures, numbers and symbolic information.
Curated OER
Energy Choices
Students add and multiply decimals to complete gas choice worksheets. They discover which gas supplier has the best gas prices. Students collect and interpret data about local natural gas suppliers and use this information...
Curated OER
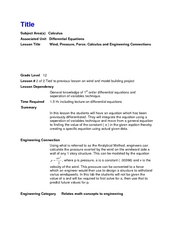
Wind, Pressure, Force, Calculus and Engineering Connections
Twelfth graders solve first order differential equations using the separation of variables technique. In this calculus lesson, 12th graders explain the connection between math and engineering. They brainstorm what engineers do in real life.
University of South Florida
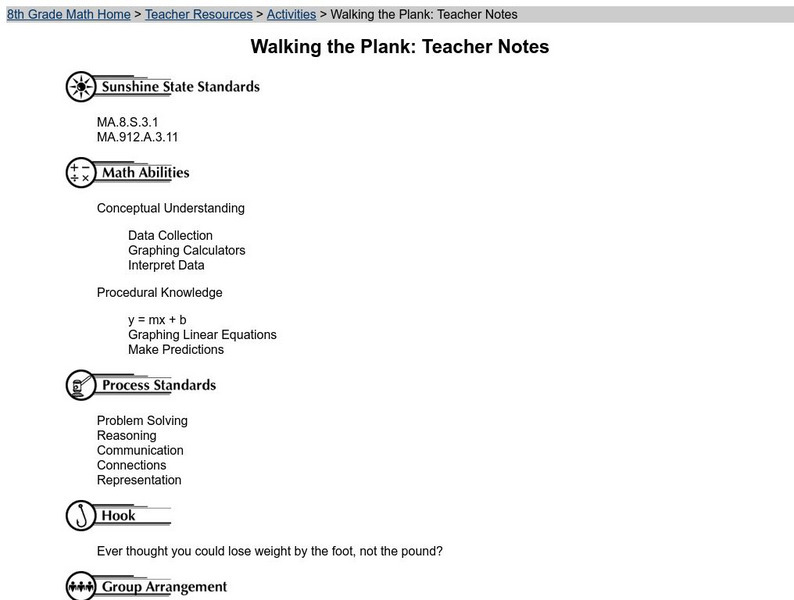
Florida Center for Instructional Tech: Walking the Plank
Students use weight to collect data and investigate the linear relationship. This activity uses a graphing calculator.
PBS
Pbs Teachers: Building Boxes [Pdf]
By determining the dimensions necessary for building a box with the greatest volume, students will explore the world of polynomial and rational expressions. Graphing calculators can be used for this activity.
Alabama Learning Exchange
Alex: My Peanut Butter Is Better Than Yours!
The students will engage in the process of statistical data comparing data using tables and scatterplots. The students will compare data using measures of center (mean and median) and measures of spread (range). This instructional...
Teachnology
Teachnology: Math Lesson Plans
Great lesson plans covering a wide-range of math-related subjects.
Alabama Learning Exchange
Alex: Don't Compound the Problem
Middle schoolers will be able to determine the probability of a compound event. Drawing on their knowledge of simple probability to find the probability of more complex outcomes. Students will create a poster, PowerPoint, booklet, or...


![Pbs Teachers: Building Boxes [Pdf] Lesson Plan Pbs Teachers: Building Boxes [Pdf] Lesson Plan](https://d15y2dacu3jp90.cloudfront.net/images/attachment_defaults/resource/large/FPO-knovation.png)


