Curated OER
Graphing Calculator Investigation - Second Degree Polynomial Functions
Young scholars solve quadratic functions. In this solving quadratic functions lesson, students determine the height of an object at a given time. Young scholars determine the time at which an object hits the ground. Students answer...
Curated OER
Murder in the First Degree - The Death of Mr. Spud
Secondary learners investigate exponential functions in a real-world scenario. They collect data on the temperature of a cooling baked potato, enter the data into lists, and graph the data using a scatter plot before finding an...
Curated OER
Quadratic Equations with the CBL 2
Learners practice generating parabolas with a motion sensor while determining the vertex form of the equation. They compare it to the regression equation from the calculator onto a data mate software. Each student completes several...
Curated OER
Graphing Functions With 2 Points and From a Graph
Learners plot points on a coordinate plane. They describe, in words, methods for finding the slope of a line. After given a worksheet, students read instructions, draw a Cartesian plane, plot ordered pairs, and graph lines. Papers are...
Curated OER
Geometric Sequences and Series
Learners find common ratios of geometric sequences on a spreadsheet. Using this data, they create scatter plots of the sequences to determine how each curve is related to the value of the common ratio. They will consider whether series...
Curated OER
The Great Race
Students are presented with a story about two individuals running a race in which one is given a head start. Students must map the progress of the runners, create a chart examining patterns and graph the progress. In the end, students...
Curated OER
Coordinate Graphs, Translations and Reflections
Young scholars perform translations and reflections. In this algebra lesson, students use the TI calculator to graph functions. They move the functions around on the coordinate plane using translation and reflection.
Curated OER
Solving Quadratic Equations by Graphing
Students solve quadratic equation by graphing. In this algebra instructional activity, students use the TI calculator to get a visual of their graph. They create a table of values, plot their points and graph the parabola.
Curated OER
Graphing Quadratic Functions
Students graph quadratic functions. In this algebra lesson, students identify the vertex and intercepts of a quadratic equations and graph the parabola. They find the axis of symmetry and make a table to find the values of the parabola.
Curated OER
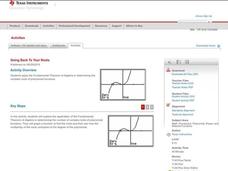
Going Back to Your Roots
Who doesn't need to know the Fundamental Theorem of Algebra? Use the theorem to find the roots of a polynomial on a TI calculator. The class explores polynomials with one solution, no real solutions, and two solutions. This less lesson...
Curated OER
Voter Turnout
Explore politics by analyzing the voting process. Pupils discuss the purpose of casting votes in an election, then examine graphs based on the data from a previously held election's turnout. The lesson concludes as they answer study...
Virginia Department of Education
Rational Functions: Intercepts, Asymptotes, and Discontinuity
Discover different patterns by making connections between a rational function and its graph. An engaging lesson asks scholars to explore the behavior of different rational functions. Groups discover a connection between the function...
EngageNY
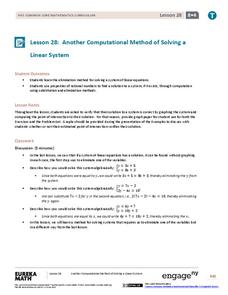
Another Computational Model of Solving a Linear System
The process of elimination really works! Use elimination when substitution isn't doing the job. The 29th segment in a series of 33 introduces the elimination method to solving linear systems. Pupils work several exercises to grasp the...
Alabama Learning Exchange
Building Functions: Reverse to Inverse
Reverse the wrapping to get to the gift. Using the idea of unwrapping a gift, the lesson introduces the concept of inverses. Pupils first determine the order needed to evaluate a function at a point, then use the reverse to find the...
Curated OER
Exploring Transformations with Matrices
A page right out of the Holt Geometry book. Use a graphing calculator and graph paper to explore transformations with matrices.
Virginia Department of Education
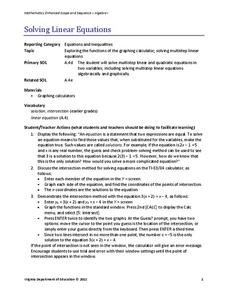
Solving Linear Equations
Practice solving linear equations by graphing. Scholars learn to solve multi-step linear equations in one variable by graphing both sides of the equation separately. They use graphing calculators to find the intersection of the graphs.
Curated OER
The Way to Better Grades!
Pupils collect and analyze data. For this statistics lesson, learners create a scatter plot from their collected data. They use, tables and graphs to analyze the data and mae decisions.
Curated OER
Graphing Parabolas and Circles
Students graph parabolas and circles. In this algebra lesson, students create a table of values and graph the coordinate pairs to create a graph. They graph a circle using the radius and center.
Curated OER
Graphing Linear Equations Using the Table Method
Students graph linear equations using a table. In this algebra lesson plan, students create a table of values using the linear equation to find the y-values. They plot their point on a coordinate plane and graph the line.
Curated OER
Solving Inequalities and Graphing
Students solve and graph inequalities on a number line. For this algebra lesson, students solve using addition, subtraction, multiplication and division and graph their solutions using open or closed circles. They graph with 80%-90%...
Curated OER
Match The Graph Circles
High Schoolers engage in a study of circles and graphs that are related with the focus upon finding the center and radius. The lesson includes the suggestion of giving homework using circle problems before this one to create background...
Curated OER
Graphing With RXTE
Students use data from the Rossi X-ray Tiiming Explorer (RXTE) satellite to analyze and graph.
Texas Instruments
Let's Play Ball with Families of Graphs
Learners explore quadratic equations in this Algebra II lesson. They investigate families of quadratic functions by graphing the parent function and family members on the same graph. Additionally, they write the equation of the parabola...
Curated OER
Dog Days or Dog Years?
In need of some algebraic fun with real world implications?Learners use ordered pairs, a table of values and a scatter plot to evaluate the validity of several real world data sets. The class focuses on dog ages in human...


