Curated OER
Using Symmetry to Find the Vertex of a Parabola
Learners engage in a lesson plan that is about finding the vertex of a parabola while using symmetry. They use the symmetry to find out where the two lines meet. The line is displayed with the help of a graphing calculator. The lesson...
Curated OER
Finding a Line of Best Fit
Pupils engage in the practice of creating a scatter plot with the data obtained from measuring different resting heart rates. The data is used to create the table that is translated into a graph. The lesson gives instructions for the use...
Virginia Department of Education
Factoring for Zeros
Relate factors to zeros and x-intercepts. Scholars first graph quadratics in both standard and factored forms to see that they are the same. They go on to use the graphs to see the relationship between factors and x-intercepts.
Curated OER
Maps and Modes, Finding a Mean Home on the Range
Fifth graders investigate data from maps to solve problems. In this data lesson, 5th graders study maps and collect data from each map. Students present their data in a variety of ways and calculate the mode, mean, median, and range.
EngageNY
Modeling with Quadratic Functions (part 1)
Relevance is key! The resource applies quadratic modeling by incorporating application of physics and business. Pupils work through scenarios of projectile motion and revenue/profit relationships. By using the key features of the graph,...
EngageNY
Modeling with Quadratic Functions (part 2)
How many points are needed to define a unique parabola? Individuals work with data to answer this question. Ultimately, they determine the quadratic model when given three points. The concept is applied to data from a dropped...
EngageNY
Exponential Growth—U.S. Population and World Population
Show how exponential growth can look linear. Pupils come to understand the importance of looking at the entire picture as they compare the US population to the world population. Initially, the populations look linear with the same rate...
Curated OER
Calculate the Slope of a Line Using Two Points
Find that slope! This video does an excellent job of demonstrating how to use the slope formula to find the slope of a line using two points. The instructor first reviews the definition of slope of a line, then works three problems using...
EngageNY
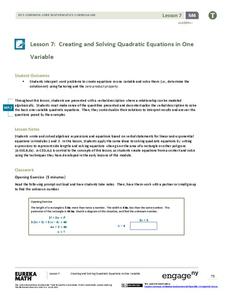
Creating and Solving Quadratic Equations in One Variable
Give your classes practice at modeling using quadratic models with a resource that uses area and integer problems to allow individuals to create second degree polynomials. Young mathematicians solve equations using factoring and then...
Virginia Department of Education
How Much is that Tune?
Tune in for savings! Scholars investigate pricing schemes for two different online music download sites. After comparing the two, they determine the numbers of songs for which each site would be cheaper.
National Research Center for Career and Technical Education
Architecture and Construction: Stair Construction
Within the context of the construction industry, algebra pros begin to calculate slope from the sizes of stair steps. This is a terrific activity, especially for aspiring engineers. Just be aware that it might be a stretch to meet all of...
EngageNY
Inverse Functions
Undo the functions. Learners refresh their knowledge of inverses of functions from Algebra II in the 19th section of a 23-part Precalculus unit. Pupils look at inverses in tables and graphs. They then add to their understanding of...
Curated OER
Solving Systems of Equations by graphing for Algebra One
Students watch the teacher demonstrate on an overhead projector how to graph various equations before the students try them on their own. They start with pencil and paper; once they grasp the concept they move on to punching in the...
Curated OER
Finding Patterns and Graphing Functions
Pupils investigate patters for area and perimeter. In this Algebra I/Geometry lesson, students explore two different patterns as they write a formula for the nth term of each pattern. Pupils graph their results and determine if the...
Curated OER
Algebra- Cell Phone Plans
Learners analyze graphs to compare cell phone plans. In this algebra lesson, students work together to analyze phone plans and report the best phone plan. Learners develop tables and graphs.
Curated OER
Graphing Linear Equations on the TI
Students graph linear equations on the TI calculator. In this algebra lesson, students rewrite equations in the slope intercept form and use the calculator to graph their problem. They work together to interpret the graphs off of the TI.
Curated OER
The Closer I Get To You
Pupils explore the law of reflection. Through experimentation and problem solving, they collect and analyze data pertaining to reflection. The data is plotted on a graph and formulas for calculating the x and y values are evaluated.
Curated OER
Algebra II: Exponential Functions
Students investigate, describe, and predict the effects of parameter changes on the graphs of exponential functions; describe limitations on the domains and ranges of these functions; and examine asymptotic behavior.
Curated OER
Pizza Topping Combinations
Students brainstorm pizza toppings and determine the number of possible ways to order a pizza. In this algebra lesson plan, students analyze and investigate geometric patterns as they relate to the concept of a variable. Students...
Curated OER
Exploration Sequence of Bounces
New skills are developed as students use graphing calculators and ranger technology to capture and graph the sequence of bounces a ball makes when dropped. After recording the height of four or more bounces, they use the collected data...
Curated OER
Zeros of Polynomials
High schoolers graph polynomials. In this Algebra II instructional activity, students investigate the graph of a polynomial to determine the value and the number of zeros. This instructional activity requires the use of a graphing...
Curated OER
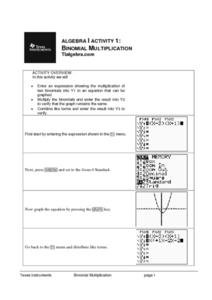
Binomial Multiplication
Learners explore binomial multiplication through the use of technology. Using a graphing calculator, you pupils enter the binomial expression into Y1, multiply the binomials and enter that result into Y2, and combine like terms and enter...
Curated OER
The Apple Orchard Problem
Students explore various approaches to solving a problem of maximizing the total production of apples in an orchard. In this apple orchard lesson plan, students collect data in order to solve the apple orchard problem presented. Students...
Curated OER
Make a Pass at Me
Students identify different types of functions and units of measurements. In this statistics lesson, students will collect data, graph their data and make predictions about their data. They plot a linear regression graph.


