Mathematics Vision Project
Module 7: Structure of Expressions
The structure of an expression is a descriptive feature. Learners build a solid understanding of quadratic functions using an analysis of expressions in different forms. The seventh module in a series of nine includes 12 lessons...
Curated OER
Narrow Corridor
Buying a new sofa? Learn how to use the Pythagorean Theorem, as well as algebra and graphing techniques, to determine whether the sofa will fit around a corner (which I'm sure you'll agree is a very important consideration!).
Ohio Department of Education
I Can Do This! Systems of Equations
Use tables, graphs, and substitution to solve systems of linear equations. An envelope of sample problems is passed around the classroom, and each learner has the opportunity to solve the system in the envelope. This is a great way to...
Mathematics Assessment Project
College and Career Readiness Mathematics Test B2
Use a nine-page evaluation to cover material from algebra, geometry, and algebra II. It incorporates short answer, applied reasoning, and conversion problems.
Concord Consortium
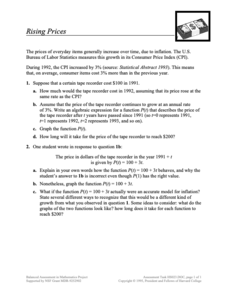
Rising Prices
What will that cost in the future? The scenario provides pupils with a growth as a Consumer Price Index. Learners create functions for a given item to determine future prices and graph them. Class members then compare their functions to...
Inside Mathematics
Quadratic (2006)
Most problems can be solved using more than one method. A worksheet includes just nine questions but many more ways to solve each. Scholars must graph, solve, and justify quadratic problems.
University of Colorado
Distance = Rate x Time
Every year, the moon moves 3.8 cm farther from Earth. In the 11th part of 22, classes use the distance formula. They determine the distance to the moon based upon given data and then graph Galileo spacecraft data to determine its movement.
Curated OER
Two Step Inequalities
In this algebra worksheet, 11th graders solve two step algebraic inequalities and graph their solution on a number line. This worksheet contains 20 graphing problems with an answer key.
Curated OER
Solving Systems of Inequalities
In this algebra worksheet, students solve systems of inequality using the graphing method. There are 5 questions with lots of examples and an answer key.
Curated OER
Absolute Value Inequalities
In this algebra worksheet,students solve inequality equations and graph their answers on a number line. There are 22 questions with an answer key.
Curated OER
Solving Inequalities
In this algebra worksheet, students solve inequality equations and graph them on the number line. There are 22 questions with an answer key.
Curated OER
Graphing Linear Equations
Ninth graders review the information that they have already learned
with regard to linear equations and graphical representations. They then assist in combining equations with a graphical element and complete various graphs with this...
Curated OER
Bar Graphs and Pie Charts
Students graph data they collected and analyze it using a bar graph. In this algebra activity, students analyze their data using pie charts and bar graphs while explaining the meaning to each other. They compare and contrast bar...
Curated OER
Chapter 2 Practice Test
In this algebra worksheet, students examine and graph linear equation, inequalities, and absolute value inequalities in two variables. The three page worksheet contains forty-six problems. Answers are not included.
Curated OER
Between The Extremes
Students analyze graphs for specific properties. In this algebra lesson, students solve equations and graph using the TI calculator. They find the different changes that occur in each graph,including maximum and minimum.
Curated OER
Rational Function Graphs
Students use algebraic methods to represent and solve problems. Using a graphing calculator, students solve rational and inequality problems. They visually demonstrate solutions of functions through graphing. Students answer questions...
Curated OER
System of Two Quadratic Inequalities
Pupils set up and solve a system of quadratic inequalities related to real-world situations.
5280 Math
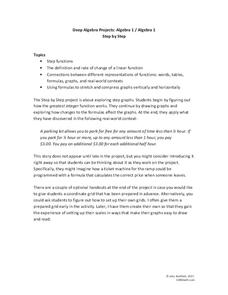
Step by Step
One step at a time! A seemingly linear relationship becomes an entirely new type of function. Young scholars build their understanding of step functions by completing a three-stage activity that incorporates multiple representations of...
Kenan Fellows
Density
Most scholars associate density with floating, but how do scientists determine the exact density of an unknown liquid? The third lesson in a seven-part series challenges scholars to find the mass and volume of two unknown liquids. Each...
Illustrative Mathematics
Peaches and Plums
According to the resource graph, which costs more: peaches or plums? Algebra learners compare two proportional relationships and then throw in a banana. Leaving out the scale helps students become intuitive about graphing.
Inside Mathematics
Population
Population density, it is not all that it is plotted to be. Pupils analyze a scatter plot of population versus area for some of the states in the US. The class members respond to eight questions about the graph, specific points and...
Shodor Education Foundation
InteGreat
Hands-on investigation of Riemann sums becomes possible without intensive arithmetic gymnastics with this interactive lesson plan. Learners manipulate online graphing tools to develop and test theories about right, left, and midpoint...
Kenan Fellows
Solutions
Scientists require specific chemical solutions for their experiments. In the seventh and final installment in a series that integrates chemistry and algebra II, scholars learn to set up a system of equations to solve the volume of a...
Wisconsin Online Resource Center
Oversized Inch
Each member of the class creates their own paper ruler. Using their ruler, kids walk around the room measuring the objects you've specified. Discuss how items should be measured to the 16th of an inch, the smallest unit on their ruler....


