EngageNY
Solution Sets for Equations and Inequalities
How many ways can you represent solutions to an equation? Guide your class through the process of solving equations and representing solutions. Solutions are described in words, as a solution set, and graphed on a number line....
Curated OER
Graphing Inequalities and Shading
Students graph and shade inequalities. In this algebra lesson, students graph inequalities using the slope-intercept form. They shade the side of the line that is the solution and identify the domain and range.
EngageNY
Perimeter and Area of Polygonal Regions Defined by Systems of Inequalities
When algebra and geometry get together, good things happen! Given a system of inequalities that create a quadrilateral, learners graph and find vertices. They then use the vertices and Green's Theorem to find the area and perimeter of...
Curated OER
What Functions do Two Graph Points Determine?
Your algebra learners write linear, exponential, and quadratic equations containing the same two graph points in this collaborative task.
Virginia Department of Education
Inequalities
Compare graphing an inequality in one variable on a number line to graphing an inequality in two variables on a coordinate plane. Young mathematicians work on a puzzle matching inequalities and their solutions. They then complete a...
Curated OER
Equations and Inequalities
Students in a college algebra class use graphs to solve inequalities. Using the coordinate graphing system, they represent the relationship between x and y intercepts. They practice solving equations with complex numbers and locate...
Curated OER
Functions of Algebra
Learners use technology graph and evaluate linear inequalities. They write and manipulate inequalities for use on a graphing calculator. In addition they apply their skills to analyze inequalities. Answer Key included.
Curated OER
Solving Inequalities and Graphing
Students solve and graph inequalities on a number line. For this algebra lesson, students solve using addition, subtraction, multiplication and division and graph their solutions using open or closed circles. They graph with 80%-90%...
Curated OER
Simple Inequalities on a Number Line
Students solve inequalities problems. In this algebra lesson, students graph the solution of inequalities on a number line. They discuss boundaries and open or closed intervals.
Curated OER
Worksheet #5: Mixture Word Problems
In this mixture word problem worksheet, young scholars read story problems and determine what information is necessary to solve the mixture problem. They identify the correct solution, graph inequalities, and solve inequality equations....
Curated OER
Inequalities Involving Absolute Value
Students solve and graph inequalities involving absolute value. They discuss and identify the basic properties of inequalities, and solve basic examples.
Curated OER
Systems of Linear Inequalities
The class solves systems of linear inequalities. They graph lines and identify the point of intersection.They graph lines and identify the boundary that represent the solution and solution set.
Curated OER
Introduction of Single and Multiple Linear Inequalities
Students solve linear inequalities. In this algebra lesson plan, students rewrite inequalities using one and two step equations. They graph their findings and identify the slope and solution of the line.
Curated OER
Spaghetti Graphs
Students work in pairs to test the strength of spaghetti strands. They collect and graph data to determine a line of best fit. Students create a linear equation to interpret their data. Based on the data collected, students predict...
Curated OER
Graph Related Linear Inequalities
Students explore the concept of linear inequalities. In this linear inequality activity, students graph linear inequalities using Microsoft Excel.
Curated OER
Systems of Inequalities
Students solve and graph a system of inequality. In this algebra lesson, students calculate the solution of a system through graphing. They test their coordinate pair and shade on the correct side of the line. They review rules for...
Curated OER
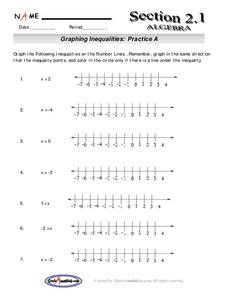
Graphing Inequalitites
Ninth graders graph inequalities. In this algebra lesson, 9th graders graph equations on a number line using inequalities and plain numbers. They solve inequalities with negative numbers also.
Curated OER
Residential Power System
Perform data analysis on energy consumption to apply algebraic expressions to the real world. Learners will write and solve equations that answer various questions from residential power use. They will collect data at home and calculate...
Curated OER
Barbie Bungee
Middle and high schoolers collect and analyze their data. In this statistics lesson, pupils analyze graphs for linear regression as they discuss the relationship of the function to the number of rubber bands and the distance of the...
Illustrative Mathematics
Fishing Adventures 2
This resource is part of a series which expects participants to be familiar with graphing inequalities on a number line. It is a word problem that asks your class to graph a discrete solution set and interpret it in the context of an...
Curated OER
Graphing Solutions To Inequalities On A Number Line
Eighth graders graph solutions to problems on a number line. After discussing algebraic expressions, 8th graders discuss how to solve them using an inequality. They observe examples and then work problems at their desks and on the...
Curated OER
Linear Inequalities
Ninth graders graph linear inequalities. In this Algebra I lesson, 9th graders examine the graph of a linear inequality and in a game format, test coordinates to determine the region of the graph that satisfies the inequality.
Curated OER
Systems of Linear Inequalities 2
Students solve systems of inequalities. In this lesson plan, they identify the solution of the two lines and shade the solution. They identify the boundary line and the region representing the solution.
Curated OER
Exploring Graphs of Inequalities
Learn how to solve inequalities and graph their answers. Students use addition, subtraction, multiplication and division to solve problems. They analyze their graph using the TI calculator.


